How have alcohol-related injury hospitalisations changed over time?
This section compares hospitalisations data over time and includes the first few months of the COVID-19 pandemic and the central Sydney liquor licencing restrictions that were in force from 2014 to 2021 (Donnelly and Poynton 2019). The effect of the COVID-19 pandemic on the data is considered in more detail in the COVID-19 section of this report.
Hospitalisation data are divided into two distinct time periods: 2010–11 to 2016–17 and 2017–18 and 2019–20. Comparisons of hospitalisations data between these two time periods is not recommended due to a change in data collection methods between 2016–17 and 2017–18 (see Technical notes for more details). Comparisons presented here are for within each of the two time periods.
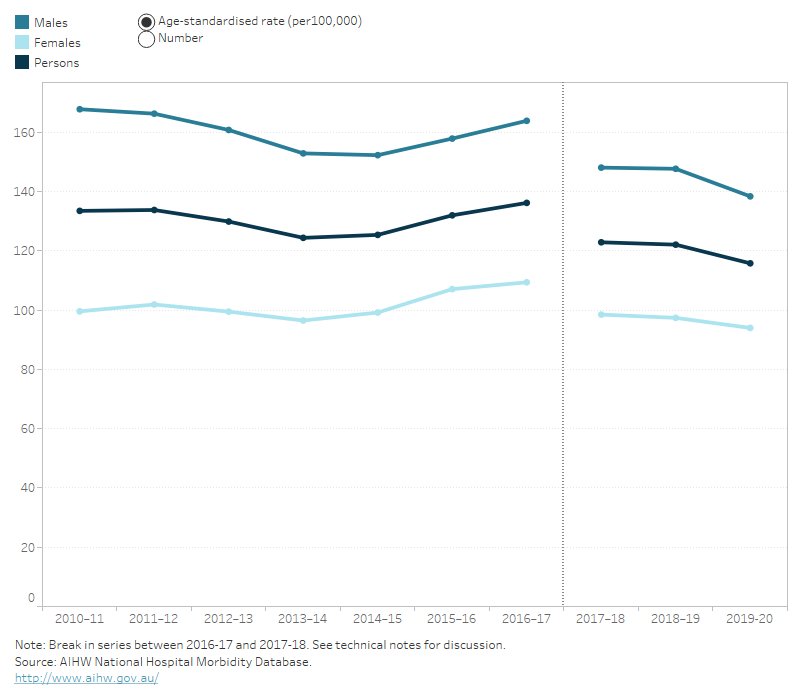
Figure 14 shows:
- a 5.2% decrease in the rate of alcohol-related injury hospitalisations in 2019–20 compared to the previous year (see COVID-19 section)
- a 6.3% and a 3.5% decrease in hospitalisations for males and females, respectively in 2019–20 compared to the previous year
- from 2010–11 to 2016–17, the average annual change in alcohol-related injury hospitalisations remained relatively stable with a 0.3% increase in the age standardised rate.
Figure 14: Age-standardised rate and number of alcohol-related injury hospitalisations, by sex, 2010–11 to 2019–20
Line graph showing that alcohol-related injury hospitalisations for both males and females fluctuated over the years but overall remained steady from 2010–11 to 2016–17 with 0.2% percentage increase in rate. From 2018–19 to 2019–20 the rate decreased by 5.2%.

For more detailed data, see Data tables A39–41.
Donnelly N and Poynton S (2019) The effect of lockout and last drinks laws on non-domestic assaults in Sydney: An update to March 2019 (Bureau Brief No. 142), Sydney: NSW Bureau of Crime Statistics and Research.


