Priority populations
Aboriginal and Torres Strait Islander people
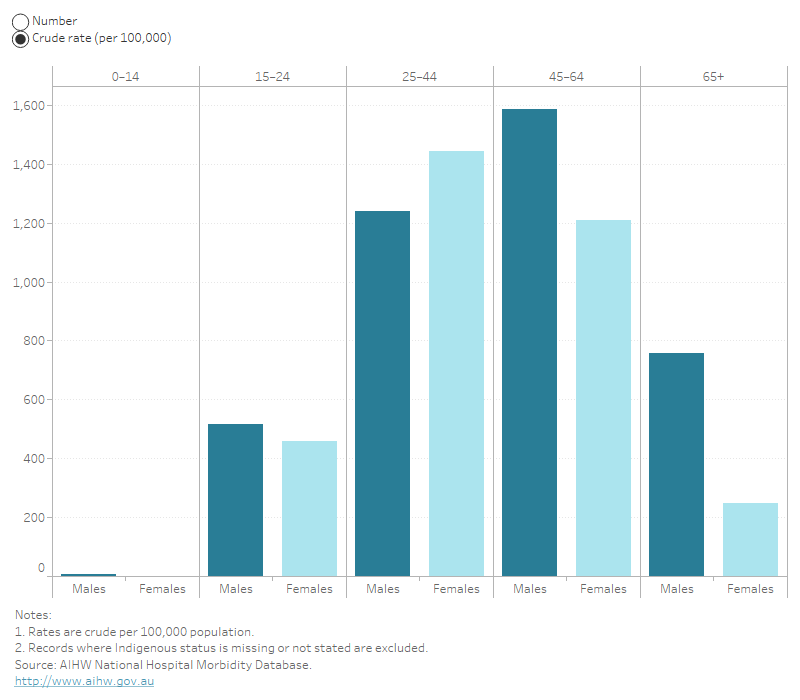
Nearly 6,000 hospitalisations due to alcohol-related injuries in 2019–20 were for Aboriginal and Torres Strait Islander people (Figure 15). There were slightly more hospitalisations for Aboriginal and Torres Strait Islander males than females (51% of were males; 49% were females) and the crude rate per 100,000 was higher for males (714) than females (689).
After adjusting for differences in age, males had an age-standardised rate of 932 cases per 100,000 population and females 837 cases.
The highest crude rate was for males aged 45–64 (1,585 cases per 100,000), followed by females aged 25–44 (1,444 per 100,000). The 25–44-year age group was the only one where the female rate was higher than the male rate (1,238 per 100,000) (Figure 15).
Figure 15: Number and rate of alcohol-related injury hospitalisations, Indigenous Australians, by age group and sex, 2019–20
Column chart showing that the number of hospitalisations for alcohol-related injuries among Indigenous males and females is highest in the 25–44 age group. The crude rate was highest for males aged 45–64 years old.

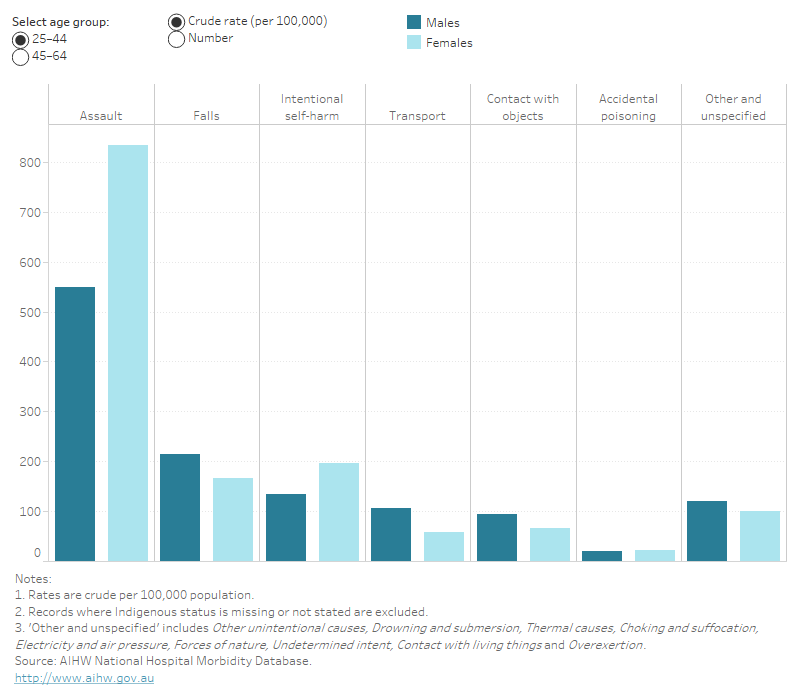
Examining the causes of injury for alcohol related hospitalisations for Indigenous Australians, shows that the assaults, falls, intentional self-harm and transport accidents are the leading causes (Figure 16).
Figure 16: Number and rate of alcohol-related injury hospitalisations, Indigenous Australians, by selected age groups, sex and cause, 2019–20
Column chart showing that the number of hospitalisations for alcohol-related injuries among Indigenous Australians is highest for both males and females for assault in the 15–44 year age group and falls in the 45 and over age group.

For more detailed data, see Data tables A45–47.
Indigenous and non-Indigenous Australians
Indigenous Australians were hospitalised due to alcohol-related injuries at a higher rate (age-standardised 879 cases per 100,000) than non-Indigenous Australians (92 cases per 100,000). In 2019–20, the age standardised rates of Indigenous and non-Indigenous alcohol-related injury hospitalisations showed (Table 9):
- the rate for Indigenous Australians was 9.5 times that of non-Indigenous Australians
- for every hospitalisation for non-Indigenous females, there were 12 hospitalisations for Indigenous females
- for every hospitalisation for non-Indigenous males, there were 8.1 hospitalisations for Indigenous males.
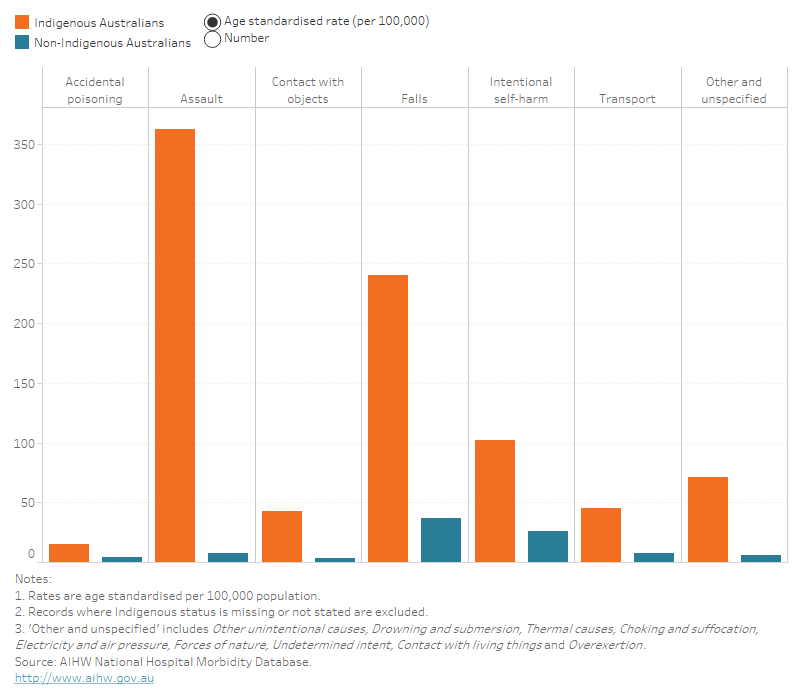
Figure 17 shows that assault and falls were the main drivers of the higher rates among Indigenous Australians.
Figure 17: Number and rate of alcohol-related injury hospitalisations, by Indigenous status and cause of injury, 2019–20
Column chart showing Indigenous Australians had higher rates of alcohol-related injury than non-Indigenous Australians where assault followed by falls were the causes of injury with the largest difference between the groups.

| Indigenous Australians | Non-Indigenous Australians | |
|---|---|---|
|
Number |
5,990 |
23,641 |
|
Crude rates |
702 |
96 |
|
Age-standardised rates |
879 |
92 |
Source: AIHW National Hospital Morbidity Database.
The ratio of rates comparing Indigenous Australians with non-Indigenous Australians is much higher for alcohol-related hospitalisations (9.5 per 100,000) than for all injury hospitalisations (including those not related to alcohol) (2.1 per 100,000) (Table 10) (AIHW 2022).
| Indigenous Australians | Non-Indigenous Australians | Rate ratio | |
|---|---|---|---|
|
Alcohol-related hospitalised injuries |
879 |
92 |
9.5 |
|
All hospitalised injuries |
3,925 |
1,878 |
2.1 |
Notes:
- This is the age-standardised rate per 100,000 people in the estimated resident population of Australia, by Indigenous status.
- Rate ratio is the age-standardised rate for Indigenous Australians divided by the age-standardised rate for non-Indigenous Australians.
Source: AIHW National Hospital Morbidity Database.
For more detailed data, see Data tables A48–50.
Remoteness
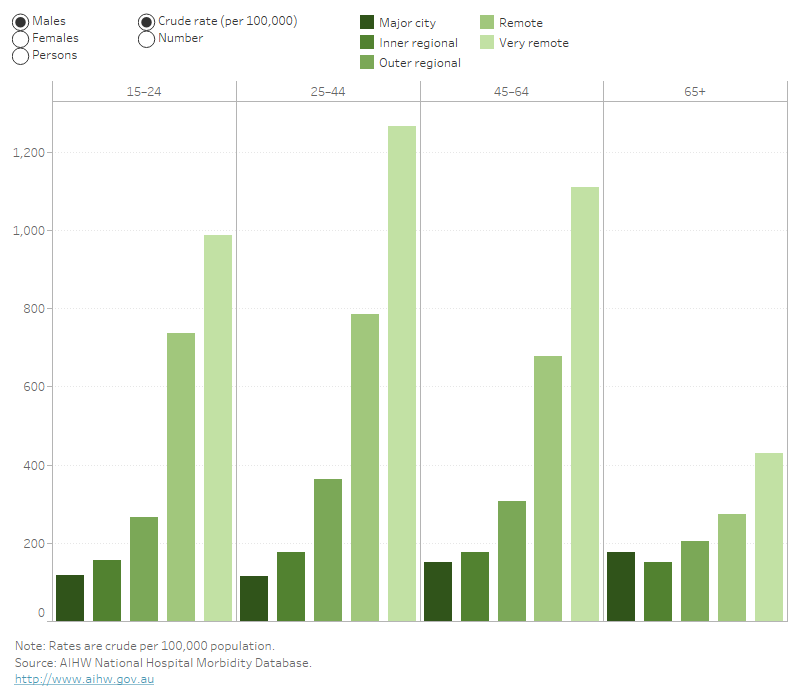
The remoteness area with the highest rate of alcohol-related injury hospitalisations was Very remote areas, with 976 cases per 100,000 population (Figure 18). This is over 8 times the national rate and almost 11 times the rate for Major cities. Among 25–44 year olds, the rate in Very remote areas is 17 times that in Major cities, with the female rate 28 times that of the male rate.
Among those aged 15 and over, males had higher hospitalisation rates across all age groups and remoteness categories, except for:
- females aged 25–44 in Remote areas, whose rate was 1.2 times that of males
- females aged 25–44 in Very remote areas whose rate was 1.7 times that of their male counterparts
- females aged 45–64 in Very remote areas, whose rate was 1.4 times that of their male counterparts.
There were 1,331 women in these three categories. Of those, 93% (1,242) were Indigenous and the rates reflect the high rates of assault of Indigenous women in these age groups (see Indigenous Australians section).
Males aged 65 and over living in very remote areas had rates more than 4 times that of their female counterparts.
Figure 18: Number and crude rate of alcohol-related injury hospitalisations, by remoteness area, age group and sex, 15 years and over, 2019–20
Bar chart showing crude rates of alcohol-related injury hospitalisations are highest in remote and very remote areas for both males and females. The highest rate was in females aged 25–44 in very remote areas.

For more detailed data, see Data tables A51–53.
Socioeconomic position of usual area of residence
The highest number and rates of hospitalisations were observed in areas with the lowest socioeconomic position. For both males and females, those in the lowest socioeconomic position were 2.1 times as likely to be hospitalised for an alcohol-related injury as those in the highest socioeconomic group.
Males aged 45–64 in the lowest socioeconomic areas had the highest rates of alcohol-related injury hospitalisations (279 cases per 100,000). Females had lower rates across most socioeconomic positions and age groups.
For more detailed data, see Data tables A54–56.
AIHW (2022) Injury in Australia, AIHW, Australian Government, accessed 18 July 2022.


