Demographic variation
Sex and age
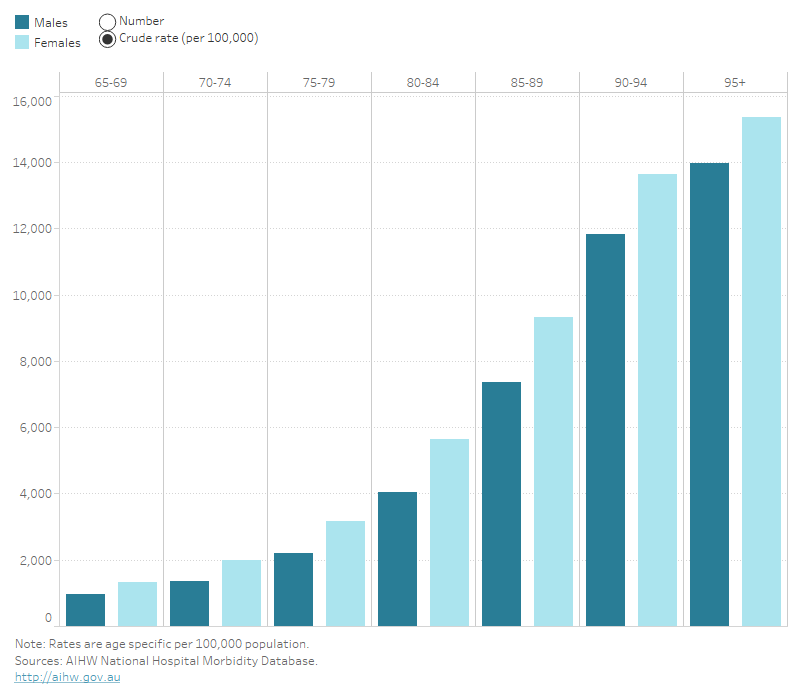
In 2019–20, among Australians aged 65 and over (Figure 3):
- 63% of hospitalisations due to falls were for females (84,400 cases) and 37% were for males (48,600 cases)
- the age-standardised rate of falls injury hospitalisations for females was 3,571 cases per 100,000, compared with 2,629 per 100,000 males
- 53% of deaths due to falls were for females (2,700 deaths) and 47% were for males (2,300 deaths)
- the age-standardised rate of falls injury deaths was higher for males (128 per 100,000), compared to females (103 per 100,000).
While the rates of falls hospitalisations and falls deaths is higher for females aged 65 and over, this is a reversal of the pattern in people aged under 65 (Figures 1 and 3). Reduced bone density in older women is a major contributing factor to this (AIHW 2020).
In 2019–20, among Australians aged 65 and over:
- 41% of hospitalisations for falls (54,600 hospitalisations) were for people aged 85 and over
- 65% of falls deaths (3,300 deaths) were for people aged 85 and over.
Figure 3: Falls injury hospitalisations and deaths, by age group and sex, 65 years and over, 2019–20
Column chart showing that across all 5-year age groups among older Australians, females had higher numbers and rates of fall related hospitalisations than males. While the rate of fall hospitalisations and deaths increased with age, those aged 85–89 had the highest number of hospitalisations compared to other age groups.

For more detailed data, see Data tables A1–3 and B1–3.
Aboriginal and Torres Strait Islander people
In 2019–20, among Aboriginal and Torres Strait Islander people aged 65 and over:
- there were 1,200 hospitalisations and 32 deaths due to unintentional falls (Tables 1 and 2)
- the age standardised rate of falls was slightly higher for females than males.
|
Males |
Females |
Persons |
|
|---|---|---|---|
|
Number |
525 |
695 |
1,220 |
|
Crude rate (per 100,000) |
2,704 |
2,989 |
2,859 |
|
Age-standardised rate (per 100,000) |
3,455 |
3,708 |
3,602 |
Source: AIHW National Hospital Morbidity Database.
|
|
Males |
Females |
Persons |
|---|---|---|---|
|
Number |
12 |
20 |
32 |
|
Crude rate (per 100,000) |
72 |
98 |
86 |
|
Age-standardised rate (per 100,000) |
n.p. |
146 |
141 |
n.p. not publishable because of volatility of age-standardised rates based on small numbers.
Note: Deaths data only includes data for New South Wales, Queensland, Western Australia, South Australia, and the Northern Territory.
Source: AIHW National Mortality Database.
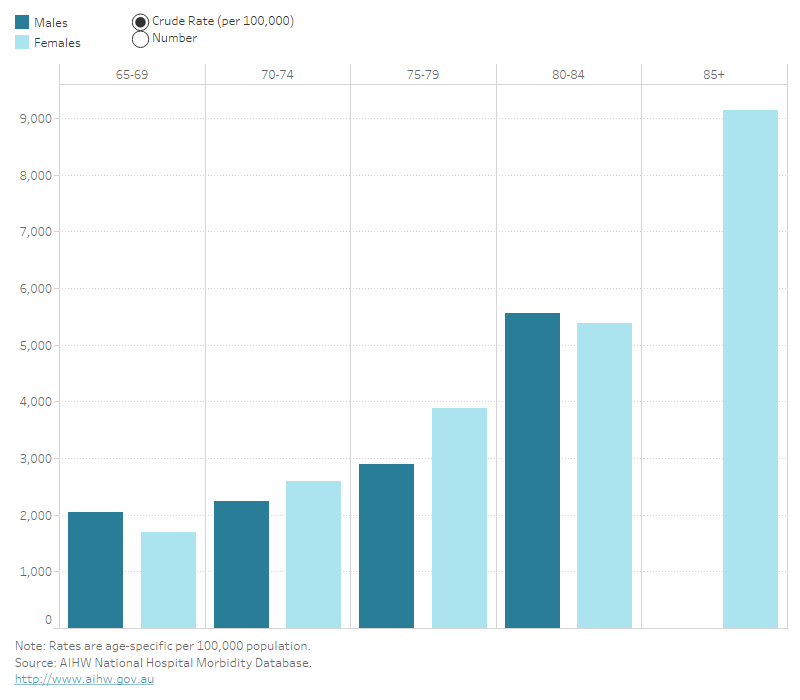
Among Indigenous Australians (in all age groups except 65–69), females had higher numbers of hospitalised falls than males. Crude rates increased with age for both sexes, but for some 5-year age groups, male rates were higher than female rates (Figure 4).
Deaths data are not presented in Figure 4 because of low numbers.
Figure 4: Falls injury hospitalisations in Indigenous Australians, by age group and sex, 2019–20
Column chart showing that the rate of hospitalised falls among older Indigenous males and females increases with age. Crude rates increased with age for both sexes, but for some 5-year age groups, male rates were higher than female rates.

For more detailed data, see Data tables A4–6 and B4–6.
Indigenous and non-Indigenous Australians
After adjusting for differences in age structure between the populations, Indigenous Australians were 1.2 times as likely to be hospitalised due to a fall than non-Indigenous Australians (Table 3). This pattern continued for deaths due to falls, where Indigenous Australians were 1.3 times as likely to die from a fall compared to Non-Indigenous Australians, although readers are advised to use these data with caution due to low numbers (Table 4).
|
|
Males |
Females |
Persons |
|---|---|---|---|
|
Indigenous Australians |
3,455 |
3,708 |
3,602 |
|
Non-Indigenous Australians |
2,591 |
3,524 |
3,103 |
Notes
- Population data for rates by Indigenous status are produced using a slightly different method to other rates. See Technical notes for more details.
- ‘Non-Indigenous Australians’ includes cases where Indigenous status is missing or not stated.
Source: AIHW National Hospital Morbidity Database.
|
|
Males |
Females |
Persons |
|---|---|---|---|
|
Indigenous Australians |
n.p. |
146 |
141 |
|
Non-Indigenous Australians |
119 |
97 |
107 |
n.p. not publishable because of volatility of age-standardised rates based on small numbers.
Notes
- Population data for rates by Indigenous status are produced using a slightly different method to other rates. See Technical notes for more details.
- ‘Non-Indigenous Australians’ includes cases where Indigenous status is missing or not stated.
- Deaths data only includes data for New South Wales, Queensland, Western Australia, South Australia, and the Northern Territory.
Source: AIHW National Mortality Database.
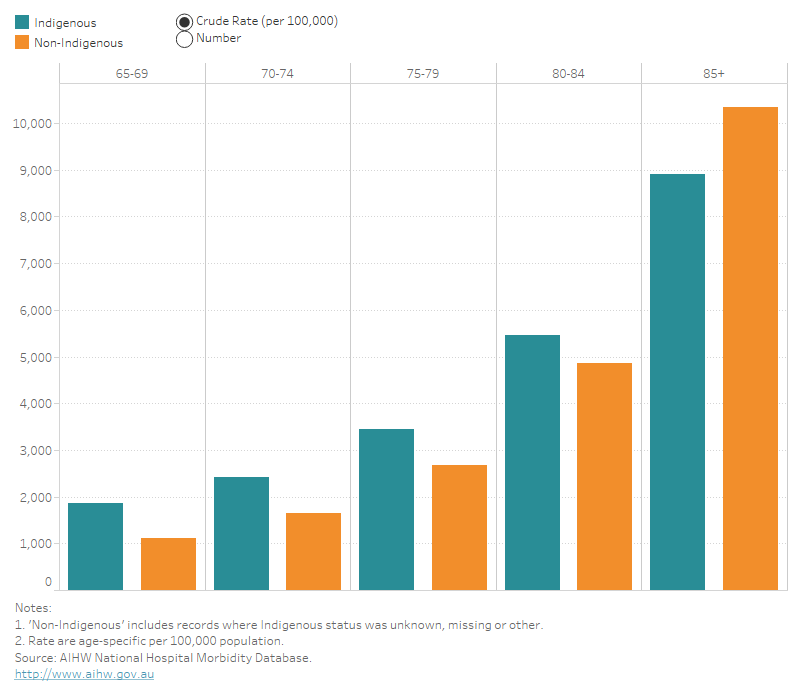
The age-specific rate of falls hospitalisations was highest among the 85-and-over age group for both male and female, Indigenous and non-Indigenous Australians (Figure 5).
Figure 5: Falls injury hospitalisations by Indigenous status, by age group, 65 years and over, 2019–20
Column graph showing Indigenous Australians had higher rates of hospitalised falls than non-Indigenous Australians for all age groups except for the 85+ age group. The same trend occurred for the crude rate for deaths.

For more detailed data, see Data tables A4–6 and B4–6.
Remoteness
Older people living in Major Cities and Very Remote areas had the highest age-standardised rates of hospitalisations for injuries from falls (about 3,300 and 3,000 cases per 100,000 respectively) while the lowest rate was for those living in Inner regional areas (about 2,700) (Table 5 and Figure 6). Fall hospitalisation rates have an atypical pattern by remoteness areas compared with most other causes of injury, which generally show that rates of injury rise with increasing remoteness (AIHW 2021e).
Deaths due to falls by remoteness also show a different pattern to other causes of injury. In 2019–20, people living in Inner Regional areas had the highest rates (AIHW 2021e) (Table 5 and Figure 6).
|
Hospitalisations (per 100,000) |
|
|---|---|
|
Major cities |
3,308 |
|
Inner regional |
2,723 |
|
Outer regional |
2,795 |
|
Remote |
2,918 |
|
Very remote |
2,989 |
|
Deaths (per 100,000) |
|
|
Major cities |
110 |
|
Inner regional |
127 |
|
Outer regional |
114 |
|
Remote and very remote |
119 |
Notes
- This is the age standardised rate per 100,000 people aged 65 and over in the estimated resident population of Australia, by remoteness areas.
- Remote and Very remote categories are combined for deaths due to low numbers.
Source: AIHW National Hospital Morbidity Database; AIHW National Mortality Database.
Compared to those aged 15–64, people aged 65 and over:
- living in Major cities were 9.8 times as likely to be hospitalised due to a fall
- living in Very Remote areas were 4.5 times as likely to be hospitalised due to a fall.
Among people aged 85 years and over:
- those living in Major cities were 9.4 times as likely to be hospitalised due to a fall than those aged 65–69
- those living in Remote areas had 7.9 times as likely to be hospitalised due to a fall than those aged 65–69.
Figure 6: Falls injury hospitalisations and deaths by remoteness, by age group and sex, 65 years and over, 2019–20
Column chart showing people living in Major Cities had the highest rate of fall hospitalisations across all ages while the lowest rate was for people living in Inner regional areas. People living in Inner Regional areas were more likely to die due to a fall than people living in Very remote areas.

For information on how statistics by remoteness are calculated, see Technical notes.
For more detailed data, see Data tables A7–9, B7–9 and C7–8.
Socioeconomic position
Table 6 shows the number of older Australians hospitalised for a fall by the socioeconomic position of the area they live in. This approach divides Australia into five socioeconomic groups, which each comprise 20% of Australia’s areas, ranging from 1 – the 20% of areas with least disadvantage to 5 – the 20% of areas with the most disadvantage.
In general, the rate of fall hospitalisations among Australians aged 65 and over was higher for people living in areas of least socioeconomic disadvantage and lower for those living in areas of most socioeconomic disadvantage (Table 6). The highest rate was for those living in the second-least disadvantaged areas, who were 1.2 times as likely to be hospitalised due to a fall than those living in the most disadvantaged areas.
The rate of fall deaths was highest for those living in the second-most disadvantaged areas, who were 1.2 times likely to die from a fall compared to those living in the least disadvantaged areas. This trend varies from hospitalisations (Table 6).
|
|
Hospitalisations (per 100,000) |
Deaths (per 100,000) |
|---|---|---|
|
1 – Most disadvantaged |
2,810 |
114 |
|
2 |
3,164 |
125 |
|
3 |
3,361 |
117 |
|
4 |
3,440 |
112 |
|
5 – Least disadvantaged |
3,366 |
100 |
Source: AIHW National Hospital Morbidity Database.
Note: This is the age standardised rate per 100,000 people aged 65 and over in the estimated resident population of Australia, by SEIFA categories.
For information on how statistics by socio-economic position are calculated, see Technical notes.
For more detailed data, see Data tables A10–12 and B10–12.


