How have falls changed over time?
This section compares hospitalisations and deaths data over time and includes the first few months of the COVID-19 pandemic. The effect of the COVID-19 pandemic on the data is considered in more detail in a separate section of this report.
Hospitalisations
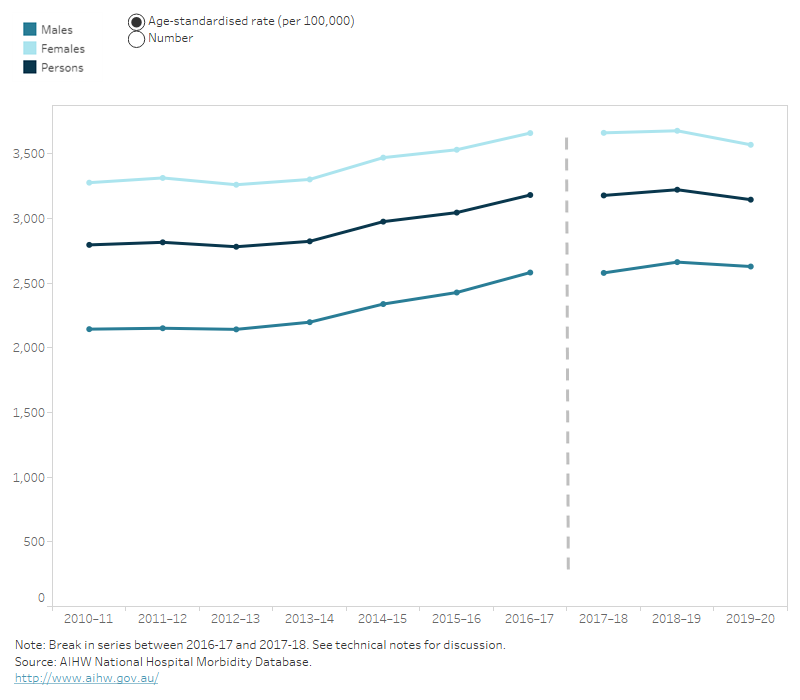
Hospitalisations data are divided into two distinct time periods – 2010–11 to 2016–17 and 2017–18 and 2019–20. Comparisons of hospitalisations data between these two time periods is not recommended due to a change in data collection methods between 2016–17 and 2017–18 (see Technical notes for more details). Comparisons presented here are for within each of the two time periods.
Figure 15 shows:
- a 2.4% decrease in the rate of falls hospitalisations in 2019–20 compared to the previous year
- from 2010–11 to 2016–17 there was an average annual increase in age-standardised fall hospitalisations of 2.2%, indicating an increase beyond that expected of an ageing population.
Deaths
Figure 15 shows:
- a 2.9% decrease in the rate of fall deaths in 2019–20 compared to the previous year
- from 2010–11 to 2019–20 there was an average annual increase in age-standardised fall deaths of 0.4%.
Figure 15: Falls injury hospitalisations, by sex, 65 years and over, in 2010–11 to 2019–20
Line graph showing that from 2010–11 to 2016–17 there has been a gradual increase in fall hospitalisations since the break in series from 2018–19 to 2019–20 there has been a slight decrease in fall hospitalisations.

For more detailed data, see Data tables A40–45 and B15–18.


