Variation between population groups
Head injuries do not affect all Australians equally. Populations that are more likely to have a head injury hospitalisation or death include:
- males
- 0–4 year-olds and those aged 65+
- First Nations people
- people living in rural and remote parts of Australia
- people living in areas of greater socioeconomic disadvantage.
Males tend to have higher numbers and rates across most age groups, cause groups, injury types, and sites of the head that are injured. In 2020–21, males contributed:
- nearly two-thirds (64%) of ED presentations and deaths due to a head injury
- 55% of head injury hospitalisations.
Females aged 75 and over had higher numbers and rates of head injury hospitalisation than their male counterparts.
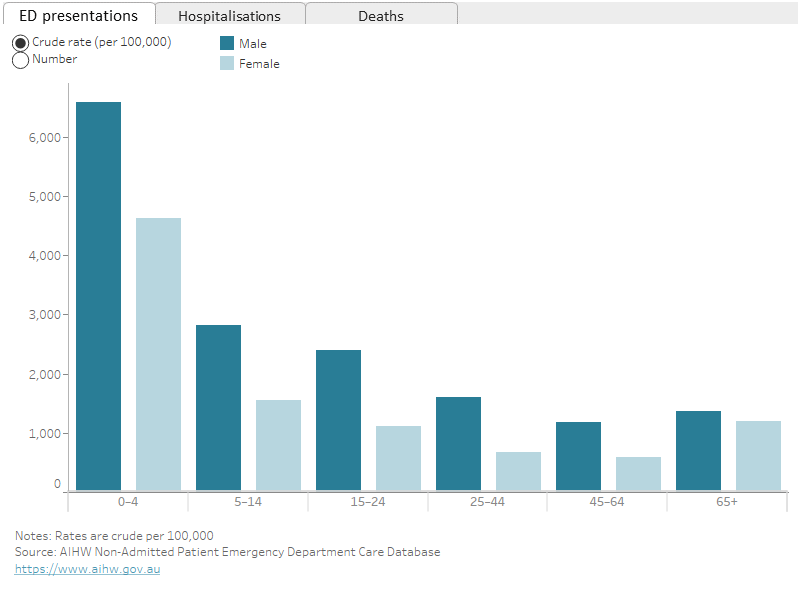
The 0–4 age group had the highest rates of ED presentations for head injuries (1 per 20 population), followed by the 5–14 age group (1 per 50). This is in contrast with hospitalisations and deaths data, where Australians aged 65 and over tend to have higher rates of head injury.
The 65 and over age group made up almost three–quarters of all head injury deaths (73%) with a rate of 42 head injury deaths per 100,000 (Figure 2). Males in this age group had the highest rate of head injury deaths (52 per 100,000).
Figure 2: ED presentations, hospitalisations, and deaths caused by head injuries, by age and sex, 2020–21
The graph has 3 tabs, one for emergency department presentations, one for hospitalisations, and one for deaths. The hospitalisations graph presents data for 5-year age groups from age 0 to 4 up to age 85 and over. The emergency department and deaths graphs present data in stage-of-life age groups from age 0 to 4 up to age 65 and over. The 0–4 age group had the highest rates of ED presentations for head injuries, while for hospitalisations it is the 85 and over age group, and for deaths the 65 and over age group. Males tend to have higher rates than females across all age groups and tabs, except for females aged 75 and over for head injury hospitalisations.
Priority populations
The priority populations highlight groups that disproportionately experience greater instances of and impacts from head injuries. These groups include First Nations people, people living in rural and remote parts of Australia, and people living in areas of greater socioeconomic disadvantage.
Factors that may contribute to this include:
- increased risk of suicide and self-harm (AIHW 2022c)
- reduced access to health care, including emergency services (AIHW 2022b, AIHW 2022f)
- employment in high-risk workplaces (e.g. transport and warehousing, agriculture) (SafeWork Australia 2022).
Injuries are the second leading contributor to the burden of disease for First Nations people (AIHW 2022b).
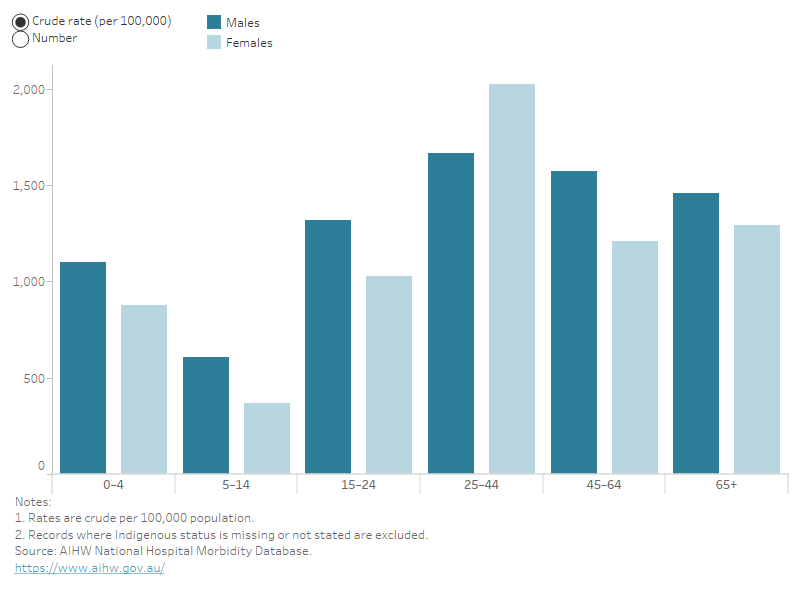
For head injuries in 2020–21, Figure 3 shows that among First Nations people:
- over a quarter of injury hospitalisations involved head injuries
- there were 10,600 hospitalisations due to head injuries, contributing 7% of total head injury hospitalisations
- 55% of hospitalisations were for males
- males had a higher rate of head injury hospitalisation (1,300 per 100,000 population) than females (1,200 per 100,000) and had higher rates of hospitalisation across most cause groups
- females had higher rates of head injuries for assault than males (660 and 490 per 100,000 respectively)
- those aged 25–44 had the highest rate of head injury hospitalisation (1,800 per 100,000)
- the 25–44 age group was the only group where the hospitalisation rate for females (2,000 per 100,000) was higher than the rate for males (1,700 per 100,000).
Figure 3: Number and rate of head injury hospitalisations, First Nations people, by age group and sex, 2020–21
Bar chart showing that male First Nations people have higher numbers and rates of head injury hospitalisations across all age groups except for the 25-44 age group, where females are higher.
There were 65 head injury deaths among First Nations people in 2020–21 in the 5 states and territories for which data are available (New South Wales, Queensland, Western Australia, South Australia, and the Northern Territory).
Males were 2.8 times as likely to die from a head injury as females, using crude rates (13 and 4.5 per 100,000 respectively) (Table 1).
| Males | Females | People |
|---|---|---|---|
Number of Deaths | 48 | 17 | 65 |
Crude Rate (per 100,000 population) | 12.7 | 4.5 | 8.6 |
Age standardised Rate (per 100,000 population) | 15.4 | n.p. | 10.3 |
n.p. Not publishable because of data volatility.
Source: AIHW National Mortality Database.
First Nations and non-Indigenous Australians hospitalisations
First Nations people were 2.8 times as likely to have a head injury hospitalisation than non-Indigenous Australians. This is slightly higher than for injury hospitalisations overall, where First Nations people were 2.1 times as likely to be hospitalised.
The disparity was largest in First Nations females who were 3.2 times as likely than non-Indigenous Australian females to be hospitalised for head injury. For First Nations males the corresponding rate was 2.5 times that of non-Indigenous Australian males.
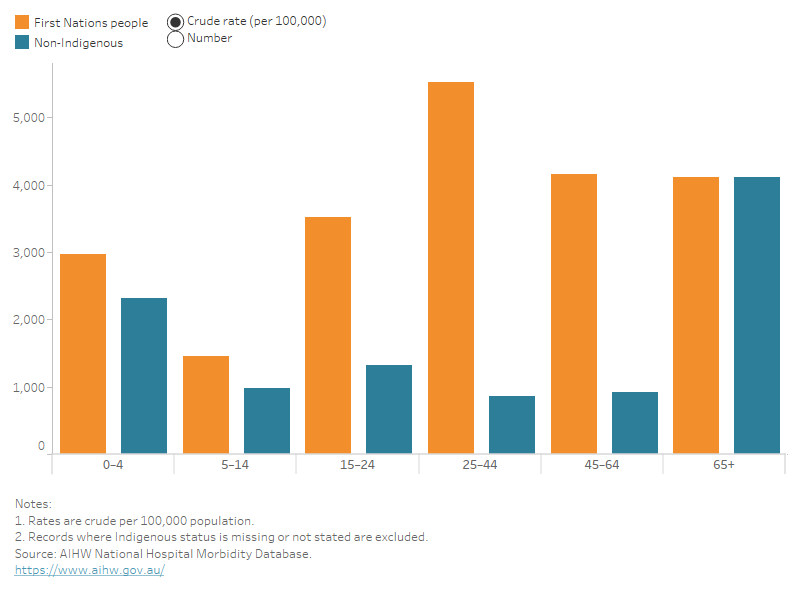
Across all age groups, First Nations people had higher rates of head injury hospitalisations than non-Indigenous Australians except for the 65 and over age group, where rates were comparable (1,400 per 100,000), shown in Figure 4.
Those aged 25–44 were particularly affected and in 2020–21 this age group:
- was 6.4 times as likely to have a head injury hospitalisation compared to non-Indigenous Australians in the same age group
- had rates of head injury caused by assault 18 times higher compared to non-Indigenous Australians
- Had rates of head injury caused by intentional self-harm 7 times higher compared to non-Indigenous Australians
- had the highest rates amongst First Nations people, (compared with being the lowest among non-Indigenous Australians).
Figure 4: Number and rate of head injury hospitalisations, by First Nations status and age group, 2020–21
Bar chart showing that First Nations people have higher numbers and rates of head injury hospitalisations across all age groups except for the 65 and over age group, where numbers are comparable with other Australians.
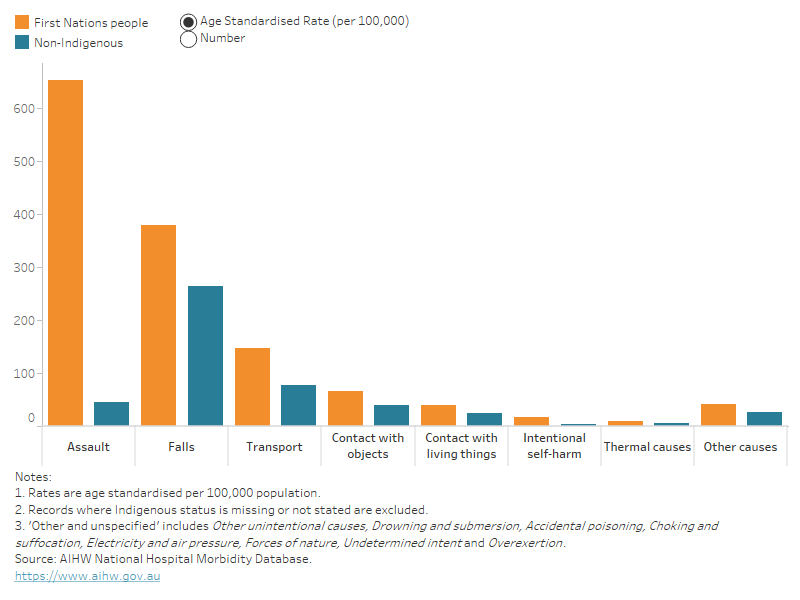
Across all groups of injury causes, First Nations people had higher age–standardised rates than non-Indigenous Australians (Figure 5). The causes where First Nations people most disproportionately experienced head injury hospitalisations were:
- assault (15 times more likely than non-Indigenous Australians)
- intentional self–harm (5.5 times more likely than non-Indigenous Australians).
Figure 5: Number and age–standardised rate of head injury hospitalisations, by Indigenous status and cause of injury, 2020–21
Bar chart showing that First Nations people have higher numbers and rates of head injury hospitalisations across all cause groups.
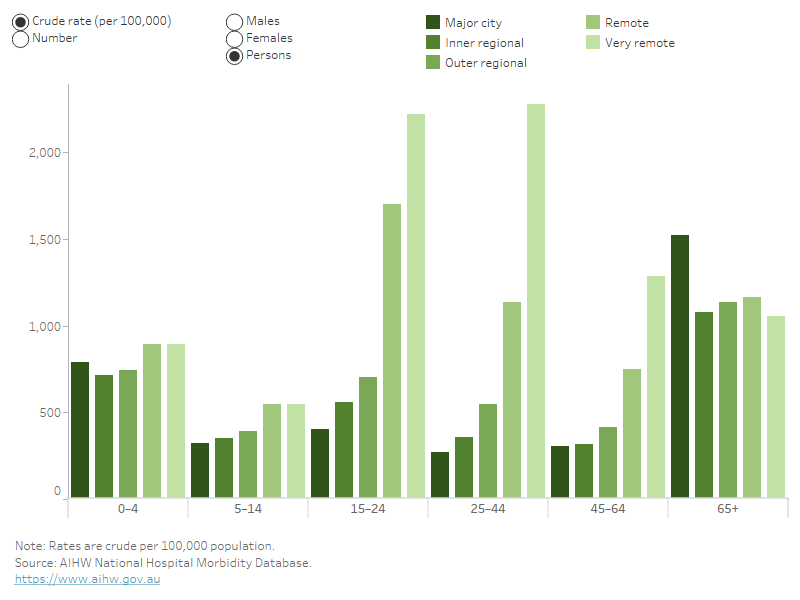
People living in very remote areas had over three times the rate of head injury hospitalisations as those in major cities, (1,600 and 490 per 100,000 population respectively) (Table 2).
Table 2: Number and age-standardised rate of head injury hospitalisations by remoteness, 2020–21
| Number of Hospitalisations | Age standardised Rate (per 100,000 population) |
|---|---|---|
Major city | 96,865 | 487 |
Inner regional | 24,599 | 490 |
Outer regional | 13,115 | 609 |
Remote | 2,901 | 1,059 |
Very remote | 3,105 | 1,597 |
Source: AIHW National Mortality Database.
Females in very remote areas were 1.3 times more likely to be hospitalised than males.
In very remote areas, females in the 25–44 age group had:
- the highest rate of hospitalisations, with 3 cases per 100 people
- double the rate of head injury hospitalisation compared to their male counterparts.
- rates 5.4 times higher than the national average (550 per 100,000)
- rates nearly 17 times higher than females the same age living in Major cities.
Figure 6: Number and rate of head injury hospitalisations, by remoteness area, age group and sex, 2020–21
Bar chart showing that numbers and rates of head injury hospitalisations are highest in remote and very remote areas across all age groups except for the 65 and over age group.
Head injury deaths followed the pattern of all injury deaths with a higher rate in more remote areas (AIHW 2023b). People living in very remote areas had the highest age-standardised rate (14 per 100,000) and were more than twice as likely to die from a head injury as those in major cities, who had the lowest rate (6 per 100,000) (Table 3).
| Number of deaths | Age standardised rate (per 100,000 population) |
|---|---|---|
Major city | 1,360 | 6.1 |
Inner regional | 533 | 8.7 |
Outer regional | 277 | 10.8 |
Remote | 38 | 13.3 |
Very remote | 23 | 13.7 |
Source: AIHW National Mortality Database.
The highest number and crude rates of head injury hospitalisations were observed for people living in the lowest areas of socioeconomic status. Those in the lowest socioeconomic area were 1.1 times as likely to be hospitalised for a head injury as those in the highest socioeconomic group (580 and 515 per 100,000 respectively).
After adjusting for differences in age across populations, Australians in both the middle socioeconomic area (area 3) and the most disadvantaged (area 1) had the highest age-standardised rates of head injury hospitalisation (540 per 100,000).
Males had higher rates of hospitalisation across most socioeconomic areas and age groups except for females aged 65 and over.
AIHW (2022b) Australian Burden of Disease Study: impact and causes of illness and death in Aboriginal and Torres Strait Islander people 2018, AIHW, Australian Government, accessed 25 May 2023.
AIHW (2022c) Deaths by suicide by remoteness areas, AIHW, Australian Government, accessed 25 May 2023.
AIHW (2022f) Rural and remote health, AIHW, Australian Government, accessed 25 May 2023.
AIHW (2023b) Injury in Australia, AIHW, Australian Government, accessed 6 July 2023.
Safe Work Australia (2023) Work-related fatalities, Safe Work Australia, Australian Government, accessed 15 May 2023.


