Summary
Life expectancy and causes of death
is an Australia’s health
topic
Looking at how many people die and what caused their death can provide vital information about the health of a population. Examining patterns and trends in deaths can help explain differences and changes in the health of a population, contribute to the evaluation of health strategies and interventions, and guide planning and policy-making.
In 2023, there were 183,131 deaths registered in Australia (96,180 males; 86,951 females). Less than 1% of all deaths occurred among children aged 0–4 years, while over two-thirds (68%) were among people aged 75 and over.
Causes of death are documented on death certificates by medical practitioners or coroners and coded by the Australian Bureau of Statistics (ABS) using the World Health Organization (WHO) International Statistical Classification of Diseases and Related Health Problems, 10th revision (ICD-10).
The ICD allows diseases that cause death to be grouped in a way that is meaningful for monitoring population health. The AIHW uses the disease groups recommended by WHO (Becker et al. 2006) with minor modifications to suit the Australian context.
Leading causes of death presented on this page are based on the ‘underlying cause of death’, which is the disease or injury that began the train of events leading to death. The leading causes of death are those causes which account for the greatest number of deaths (or proportion of total deaths) in a specified population for a given period.
Most deaths, however, result from more than one contributing disease or condition. Analyses using ‘associated causes of death’ may offer insight into the disease processes occurring at the end of life, or for injury causes of death, the nature of the injury. ‘Multiple causes of death’ statistics are based on both the underlying and associated causes of death.
Death counts, proportions and rates are presented on this page. Rates are presented either as crude rates or as age-standardised rates. Crude rates represent the number of deaths per 100,000 population, without adjustment for other factors such as age. Age-standardised death rates enable comparisons to be made between populations by converting age-structures to the same ‘standard’. This removes the influence of age when comparing rates between population groups with different age structures, and where causes of death may be more common in specific age groups (such as Dementia including Alzheimer’s disease in older Australians).
For more information, see Technical notes.
Leading underlying causes of death by sex and age
In 2023, the leading underlying cause of death for males was coronary heart disease, accounting for 10,343 (11%) deaths, followed by dementia including Alzheimer’s disease (Figure 1). For females, dementia including Alzheimer’s disease was the leading cause of death, accounting for 10,574 (12%) deaths, followed by coronary heart disease.
Other diseases among the 5 leading causes of deaths for males and females were: lung cancer, cerebrovascular disease (which includes stroke), and chronic obstructive pulmonary disease (COPD).
Figure 1: Leading underlying causes of death in Australia, by sex, 2023
Bar chart shows the leading underlying causes of death in 2023 were coronary heart disease for men and dementia including Alzheimer’s disease for women. Other leading underlying causes include lung cancer, cerebrovascular disease and COPD.

As well as differences by sex, the leading causes of death vary by age (Figure 2). Among infants, most deaths in 2023 were due to perinatal and congenital conditions. Land transport accidents were the most common cause of death among children aged 1–14. Suicide was the leading cause of death among people aged 15–44.
Chronic diseases caused most deaths among people aged 45 and over.
For males who died in 2023, coronary heart disease was the leading cause of death for those aged 45 and over.
For females who died in 2023:
- cancers (such as breast and lung) were the leading causes of death for those aged 45–74
- dementia including Alzheimer’s disease was the leading cause of death for those aged 75 and over.
For more information, see Leading causes of death.
Figure 2: Leading underlying causes of death in Australia, by age group and sex, 2023
Tile chart shows the leading underlying causes of death for people aged 1-44 years are external causes. Middle to older ages have more chronic disease as leading underlying causes of death.

Notes:
COPD: Chronic obstructive pulmonary disease.
- ‘Other ill-defined causes’ include the following codes: Symptoms, signs and abnormal clinical and laboratory findings, not elsewhere classified (ICD-10 codes R00–R99, excluding R95: Sudden infant death syndrome (SIDS)); Respiratory failure of newborn (P28.5); Respiratory failure, unspecified (J96.9). AIHW General Record of Incidence of Mortality (GRIM) books are available for selected leading causes of death.
- Heart failure refers to ‘Heart failure and complications and ill-defined heart disease (I50–I51)’.
- The number of deaths due to suicide should be considered preliminary and typically increase across revisions cycles, as more information becomes available in the coronial process. For information on coding practices, interpretation of suicide data, and revisions process refer to Deaths due to intentional self-harm (suicide)- external site opens in new window and Data quality: Revisions process- external site opens in new window in the Methodology of Causes of Death, Australia, ABS.
Source: AIHW National Mortality Database; Table S3.2.
Deaths due to COVID-19
In 2023, COVID-19 was the 8th leading cause of death with 5,001 deaths (Table S3.1). This represents a 49% decrease from the 9,862 deaths in 2022 that were due to COVID-19 (ABS 2024a).
The number of deaths due to COVID-19 increased with increasing age. More than half (55%) occurred among those aged 85 and over (Figure 3). For more information, see COVID-19 deaths.
Males had higher numbers of COVID-19 deaths than females for most age groups. The death rate for males aged 50 and over was between 1.3 and 2.1 times as high as females in the same age groups.
Figure 3: Number of deaths and age-specific death rates (deaths per 100,000 population) in Australia due to COVID-19, by age-group and sex, 2023
Butterfly chart shows the number and rate of death due to COVID-19 increases as age increases.

For the latest statistics and reports on deaths due to COVID-19, see ABS reports Provisional Mortality Statistics and the COVID-19 Register.
Trends in deaths over time
In Australia, death rates have declined since at least the early 1900s. Between 1907 and 2023, the crude death rate decreased by 37% (from 1,083 to 687 deaths per 100,000 population, respectively). When accounting for changes in the population age structure over this period, the age-standardised death rate fell by 75% (from 2,054 to 513 deaths per 100,000). This was largely driven by the decline of infant and child deaths during this period; from 2,412 deaths per 100,000 children under 5 in 1907 to 72 per 100,000 in 2023 (a decrease of 97%).
There was a transition from infectious diseases such as influenza and tuberculosis, which caused the most deaths in the early 1900s, to cardiovascular diseases and cancers, which became the leading causes of death from the 1930s.
See also ‘Chapter 4 Changing patterns of mortality in Australia since 1900’ in Australia’s health 2022: data insights.
With the exception of the emergence of COVID-19, the 10 leading causes of death have generally remained the same throughout the last decade, albeit with different rankings (Figure 4). COVID-19 was the 8th leading cause of death in 2023, after entering the 10 leading causes of death in 2022.
When considering the ranking of leading causes across the last decade, between 2013–2023:
- Coronary heart disease was the leading cause of death for males in both 2013 and 2023.
- Dementia including Alzheimer’s disease replaced coronary heart disease as the leading cause of death for females.
- Dementia including Alzheimer’s disease increased in ranking for both males (from 4th to 2nd) and females (from 2nd to 1st).
- Deaths (and death rates) due to lung and colorectal cancers decreased in ranking for males.
- While the ranking for lung and breast cancers remained the same in both 2013 and 2023 for females, the age-standardised death rates have decreased.
For more information, see Trends in deaths.
Figure 4: Change in disease ranking by proportion of all deaths for the leading 10 underlying causes of death in Australia, by sex, between 2013 and 2023
The leading cause of death for males and females in 2013 was coronary heart disease. In 2023 it was still the leading cause of death for males, but for females the leading cause of death was dementia including Alzheimer’s disease.

Potentially avoidable deaths
Potentially avoidable deaths are deaths among people younger than 75 that could have been prevented within the present health care system. They include deaths from conditions that are potentially preventable through individualised care and/or treatable through existing primary or hospital care. Potentially avoidable deaths serve as an indicator of the health of Australians and the performance of the healthcare system (Department of Health 2020, AIHW 2024)
Between 1997 and 2023 the potentially avoidable age-standardised death rate fell by 50% (from 193 to 97 deaths per 100,000, respectively). The downward trend occurred for both males and females. An exception to this trend is an increase in 2022, which should be considered in the context of higher overall mortality in this year (Figure 5).
Figure 5: Rates of potentially avoidable deaths by sex, 1997-2023
Side-by-side line graph shows the decrease in potentially avoidable death rate for both males and females since 1997.
| Year | Males | Females |
|---|---|---|
| 1997 | 252.9 | 136.2 |
| 1998 | 240.4 | 127.5 |
| 1999 | 232.9 | 121.0 |
| 2000 | 218.0 | 119.4 |
| 2001 | 210.4 | 113.9 |
| 2002 | 201.8 | 110.4 |
| 2003 | 194.6 | 104.3 |
| 2004 | 183.4 | 99.5 |
| 2005 | 175.3 | 94.5 |
| 2006 | 168.1 | 92.5 |
| 2007 | 163.5 | 91.5 |
| 2008 | 163.7 | 91.4 |
| 2009 | 159.4 | 89.8 |
| 2010 | 152.6 | 84.9 |
| 2011 | 148.0 | 84.4 |
| 2012 | 140.4 | 79.8 |
| 2013 | 140.9 | 78.1 |
| 2014 | 141.9 | 80.2 |
| 2015 | 142.9 | 79.7 |
| 2016 | 139.9 | 77.1 |
| 2017 | 139.1 | 76.1 |
| 2018 | 134.5 | 73.6 |
| 2019 | 135.5 | 73.1 |
| 2020 | 128.7 | 69.6 |
| 2021 | 126.0 | 69.0 |
| 2022 | 131.9 | 72.6 |
| 2023 | 126.1 | 69.2 |
Notes
- Year refers to year of registration of death. Deaths registered in 2020 and earlier are based on the final version of cause of death data; deaths registered in 2021 are based on the revised version; deaths registered in 2022 and 2023 are based on the preliminary version. Revised and preliminary versions are subject to further revision by the Australian Bureau of Statistics.
- Potentially avoidable deaths are deaths from conditions that are potentially preventable through individualised care and/or treatable through existing primary or hospital care. They are classified using nationally agreed definitions based on cause of death for people aged less than 75 (AIHW National Healthcare Agreement: PI 16 – Potentially avoidable deaths, 2022).
- Rates are expressed as deaths per 100,000 population. Crude rates are calculated using the estimated resident population at 30 June for each year. Age-standardised rates are directly standardised to the Australian estimated resident population at 30 June 2001.
Source: AIHW National Mortality Database; Table S5.1
In 2023, 48% of deaths of people aged under 75 were potentially avoidable. Of the 28,112 potentially avoidable deaths in 2023, 63% (17,805) were male and 37% (10,307) were female. The leading causes of potentially avoidable deaths differ by sex:
- for males, coronary heart disease accounted for 22%
- for females, breast cancer accounted for 16%.
Potentially avoidable deaths also differ between population groups. See Variation in deaths between population groups for more information about:
- Aboriginal and Torres Strait Islander (First Nations) people and non-Indigenous Australians
- Remoteness area
- Socioeconomic areas.
Variation in deaths between population groups
Aboriginal and Torres Strait Islander (First Nations) people
In 2023, there were 5,256 registered deaths of First Nations people in Australia. The analysis in this report relates to the 5 jurisdictions in which the quality of Indigenous status identification is sufficient for reporting – New South Wales, Queensland, Western Australia, South Australia, and the Northern Territory – and for the 3 years (2021 to 2023) combined to maximise the robustness of the findings.
In the period 2021–2023, for the 5 jurisdictions:
- there were 12,947 registered deaths of First Nations people
- the crude death rate for First Nations people was 492 deaths per 100,000 population
- the 3 leading causes of death for First Nations people were coronary heart disease, diabetes, and COPD.
The life expectancy and median age at death of First Nations people have been increasing over time, however First Nations people are more likely to die at younger ages than non-Indigenous Australians. Between the period 2021–2023:
- the median age at death for First Nations people was 63 years
- the median age at death for non-Indigenous Australians was 82 years
- after adjusting for age, First Nations people died at 1.8 times the rate of non-Indigenous Australians.
Between the period 2021–2023, 58% (5,635) of deaths of First Nations people aged under 75 were from potentially avoidable causes. First Nations people died from avoidable causes at 3.3 times the rate of non-Indigenous Australians (age-standardised rate of 306 deaths per 100,000 First Nations Australians and 93 deaths per 100,000 non-Indigenous Australians).
For more information see Health and wellbeing of First Nations people and Variation in deaths between population groups.
Remoteness areas
Rates of death and leading causes of death differ between the areas where people live. When looking at the difference in causes of death based on where people live, in 2021–2023:
- crude death rates were highest in Inner regional areas (895 deaths per 100,000 population) and lowest in Very remote areas (606 per 100,000)
- age-standardised death rates increased with increasing remoteness
- the age-standardised death rate for those in Very remote areas was 1.6 times the rate of those living in Major cities (779 and 499 deaths per 100,000 population, respectively)
- coronary heart disease, dementia including Alzheimer’s disease, COPD and lung cancer were among the 5 leading causes of death in all remoteness areas
- diabetes was among the 5 leading causes of death in Remote and Very remote areas.
The proportion and rate of potentially avoidable deaths increased with increasing remoteness. In 2021–2023:
- 47% of deaths in Major cities and 61% of deaths in Very remote areas were potentially avoidable
- the age-standardised death rate of potentially avoidable deaths among those living in Very remote areas was 3 times as high as those in Major cities (245 and 87 deaths per 100,000 population).
See Rural and remote health and Variation in deaths between population groups.
Socioeconomic areas
Rates of death and leading causes of death differ between socioeconomic areas. In 2021–2023:
- crude death rates were highest in the lowest socioeconomic (most disadvantaged) areas (849 deaths per 100,000 population) and lowest in the highest socioeconomic (least disadvantaged) areas (565 per 100,000)
- age-standardised death rates decreased with decreasing disadvantage
- the age-standardised death rate for people living in the lowest socioeconomic areas was 1.5 times the rate for people living in the highest socioeconomic areas (628 and 421 deaths per 100,000 population, respectively)
- for the leading causes, excluding dementia, the age-standardised death rate was highest in the lowest socioeconomic area, and lowest in the highest area.
The rate of potentially avoidable deaths increased with increasing levels of socioeconomic disadvantage. In 2021–2023 the age-standardised death rate of potentially avoidable death among those living in the lowest socioeconomic areas was 2.3 times greater than those in the highest socioeconomic areas (140 and 62 deaths per 100,000 population, respectively).
See Social determinants of health and Variation in deaths between population groups.
Multiple causes of death
Traditionally mortality statistics are based on the underlying cause of death, which is ’the disease or injury which initiated the train of morbid events leading directly to death, or the circumstances of the accident or violence which produced the fatal injury‘ (WHO, 2019). The underlying cause of death is important from a public health perspective to understand the point at which an intervention could have taken place to prevent the death from occurring. However, in most cases, more than one disease contributes to death. In Australia in 2023, almost 4 in 5 deaths (79%) had more than one health condition, illness or injury recorded on the medical death certificate.
Considering other diseases or health events recorded on the medical death certificate highlights the interplay of multiple diseases or conditions and the role played by each. It can give greater insight into understanding how and why Australians die, and provides a more complete picture of the health status of Australians.
To gain this insight, information on the medical death certificate can be used to understand: the most common causes that are responsible for initiating the pathway to death (underlying cause); the conditions that lead directly to death (direct causes); the causes that contribute to death (contributory causes); or all of the causes involved in a death (multiple causes). See Cause of death terminology below for further description of the types of causes.
Multiple causes: all the causes involved in causing the death (underlying, direct, and contributory). When assessed in combination these describe the most common conditions involved in causing deaths.
Underlying cause: the condition which initiated the chain of events leading to death. It provides a significant point in the sequence of events where an intervention, if available, could take place to prevent the death from occurring.
Direct causes: the health events that arise from the underlying cause. They can include consequences and complications of the underlying cause. Some direct causes reflect the health events experienced at the end of life, or conditions experienced for lengthy periods before death.
Contributory causes: the conditions that significantly contributed to the death but were not in the chain of events leading to death. Typically, these causes relate to prior or co-existing long-term health conditions, and social and other circumstances that were involved in the death. They highlight additional health conditions that could be the focus of prevention strategies, for example, the causes that contribute to chronic disease deaths.
Most common causes of death by cause type
The most common causes of death vary by the role they play in death (Figure 6).
Figure 6: Most common causes of death, by cause type, proportion of deaths, 2023
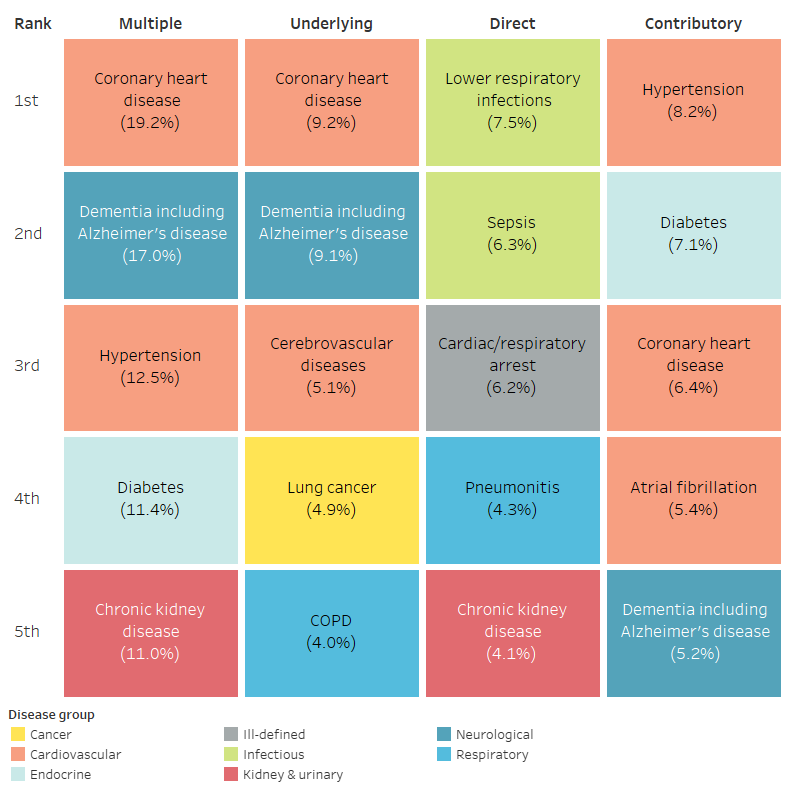
Note: Most common causes of death are based on the cause list for this multiple cause of death analysis, see Technical notes: Classifying causes of death.
Source: AIHW National Mortality Database; Table S8.5.
The most common direct causes of death in 2023 reflect terminal causes, end of life conditions or complications of underlying causes of death, with lower respiratory infections, sepsis, and cardiac/respiratory arrest the most common direct causes of death.
Contributory causes of death are often chronic or risk-factor related conditions. In 2023 hypertension, diabetes and coronary heart disease were the most common contributory causes of death.
Assessment of all causes involved in death (multiple causes) shows that considering only the underlying cause may underestimate the impact of certain conditions in causing death. For example, when considering all the causes involved in deaths in 2023:

Coronary heart disease was the underlying cause in 1 in 11 deaths but was involved in 1 in 5.

Dementia including Alzheimer’s disease was the underlying cause in 1 in 11 deaths, but the condition was involved in 1 in 6 deaths.

Diabetes was the underlying cause in 1 in 31 deaths but was involved in 1 in 9 deaths overall.

Chronic kidney disease was the underlying cause in 1 in 59 deaths but was involved in 1 in 9 deaths.
Differences by sex, age and socioeconomic area
The most common multiple, underlying, direct and contributory causes of death are different between population groups.
For males in 2023:
- coronary heart disease was the most common cause involved in deaths overall, with 23% of all deaths recording the condition
- substance use disorders (alcohol, tobacco and other drugs) were among the most common contributory causes.
For females in 2023:
- dementia including Alzheimer’s disease was the most common cause involved in deaths overall, with 21% of all deaths recording the condition
- musculoskeletal conditions (osteoporosis and osteoarthritis) were among the most common contributory causes.
The interplay between the types of causes (multiple, underlying, direct, and contributory) involved in external causes of death is particularly evident among Australians aged 15–44. The most common causes involved in death were external causes and substance use disorders, with the most common direct causes reflecting the consequential injuries of these deaths and toxic effect of substances and drugs. At these ages, the leading contributory causes were mental health conditions and psychosocial factors which are known risk factors for external causes of death such as suicide and accidental poisoning (AIHW 2025, Byrne et al 2024, Gordon & Melvin 2014, Healthdirect 2023).
Chronic diseases (such as coronary heart disease, diabetes and dementia including Alzheimer’s disease) were the most common causes involved in deaths for Australians aged 55–94. The most common direct causes reflected the health consequences of these conditions such as sepsis, lower respiratory infections and secondary cancers. Chronic and risk factor related conditions such as diabetes, hypertension and dementia including Alzheimer’s disease were common contributory causes at these ages.
Multiple cause analysis of socioeconomic areas can also be explored to highlight differences in health outcomes, which are not identified through underlying cause of death statistics alone. In the period 2021–2023, preventable conditions such as hypertension, diabetes and chronic kidney disease contributed to more deaths in the lowest socioeconomic areas compared to the highest socioeconomic areas.
For more information, see Multiple causes of death.
Life expectancy
Life expectancy measures how long, on average, a person is expected to live based on current age- and sex-specific death rates. Life expectancy at birth is expressed as the average number of years a newborn is expected to live. In Australia, a male born in 2021–2023 can expect to live to the age of 81.1 and a female can expect to live to 85.1 (ABS 2024b).
For the first time since the mid-1990's, life expectancy in Australia decreased across the years impacted by the COVID-19 pandemic. Decreases in life expectancy were seen in 2020–2022 (by 0.1 years for males and females from 2019–2021) (ABS 2022, ABS 2023b) and in 2021–2023 (by 0.1 years for males and 0.2 years for females from 2020–2022) (ABS 2024b). However, Australia still has one of the highest life expectancies in the world – ranked seventh (males and females combined) in 2023, among the 38 member countries of the Organisation for Economic Co-operation and Development (OECD) (OECD 2025).
As with death rates and leading causes of death, life expectancy varies between population groups within Australia. First Nations males born in 2020–2022 can expect to live, on average, to 71.9 and First Nations females to 75.6 (ABS 2023a). Non-Indigenous males can expect to live, on average, to 80.6 and non-Indigenous females to 83.8 (ABS 2023a): more than 8 years longer than First Nations males and females. This represents an improvement compared to 2005–2007, when the gap was 11.4 years for males and 9.6 years for females. While the gap has narrowed, the overall life expectancy for both First Nations and non-Indigenous Australians has increased over time, with the rate of improvement more pronounced among First Nations people.
For more information, see Life expectancy.
Where do I go for more information?
For more information on causes on death in Australia, see:
- General Record of Incidence of Mortality (GRIM) books
- Mortality Over Regions and Time (MORT) books
- Australian Bureau of Statistics (ABS) Deaths, Australia, 2023
- ABS Causes of death, Australia, 2023
For more on this topic, see Life expectancy & deaths.
ABS (Australian Bureau of Statistics) (2022) Life tables, 2019–2021, ABS, Australian Government, accessed 18 February 2025.
ABS (2023a) Aboriginal and Torres Strait Islander life expectancy, 2020֪–2022, ABS website, accessed 18 February 2025.
ABS (2023b) Life expectancy, 2020–2022, ABS website, accessed 18 February 2025.
ABS (2024a) Causes of Death, Australia, 2023, ABS website, accessed 17 February 2025.
ABS (2024b) Life expectancy, 2021–2023, ABS website, accessed 10 January 2025.
AIHW (Australian Institute of Health and Welfare) (2024) National Healthcare Agreement: PI 16–Potentially avoidable deaths, 2022. METEOR website, accessed 20 February 2025.
AIHW (2025) Suicide & self-harm monitoring: Behaviours & risk factors, AIHW website, accessed 21 February 2025.
Becker R, Silvi J, Ma Fat D, L’Hours A and Laurenti R (2006) 'A method for deriving leading causes of death’, Bulletin of the World Health Organization, 84:297–304.
Byrne C, Sani F, Thain D, Fletcher E. H, Malaguti A (2024) ‘Psychosocial factors associated with overdose subsequent to Illicit Drug use: a systematic review and narrative synthesis’. Harm Reduction Journal, 21, doi:10.1186/s12954-024-00999-8.
Department of Health (Department of Health and Aged Care) (2020) 2020–25 National Health Reform Agreement (NHRA). Department of Health and Aged Care website, accessed 20 February 2025.
Gordon M and Melvin G (2014). ‘Risk assessment and initial management of suicidal adolescents’, Australian Family Physician, 43(6):367–372.
Healthdirect (2023). Suicide warning signs, Healthdirect website, accessed accessed 21 February 2025
OECD (Organisation for Economic Co-operation and Development) (2025) OECD Data Explorer: Life expectancy [data set], OECD website, accessed 10 January 2025.
WHO (World Health Organization) (2019). International statistical classification of diseases and related health problems: Volume 2, Instruction manual. WHO website, accessed 18 February 2025.