Main findings

  • Around 496,000 (4.8%) people aged 45 and over in Australia were estimated to be living with COPD in 2022.

  • In 2024, COPD accounted for 3.7% of the total disease burden in Australia.

  • In 2023–24, an estimated $1.8 billion was spent on COPD (30% of all respiratory condition expenditure).

  • COPD was the underlying cause of 7,437 deaths or 28 deaths per 100,000 population in 2023 (4.1% of all deaths).

  • In 2023–24, there were 67,700 hospitalisations with a principal diagnosis of COPD for people aged 45 and over.

  • In 2022, 88% of people aged 45 and over with COPD were estimated to be living with one or more other chronic conditions.

What is chronic obstructive pulmonary disease?

Chronic obstructive pulmonary disease (COPD) is a preventable and treatable lung disease, characterised by chronic obstruction of lung airflow that interferes with normal breathing and is not fully reversible (Yang et al. 2025).

The symptoms of COPD include cough, sputum production, and dyspnoea (difficult or laboured breathing). COPD symptoms often don't appear until significant lung damage has occurred, which usually worsens over time (WHO 2023).

Multiple risk factors contribute to the development of COPD, including: 

  • genetic factors and early life events that affect lung growth, including asthma
  • infections that cause damage to the lungs
  • tobacco smoking, including both active smoking and passive exposure to smoke
  • environmental factors, such as living or working in areas with exposure to dust, gas, smoke or other air pollutants.

For more information on COPD, including diagnosis, symptoms, causes and treatments, see Chronic obstructive pulmonary disease (COPD) | healthdirect (Health Direct 2025).

How common is COPD?

  • In 2022, 4.8% (496,000) of people aged 45 and over were estimated to be living with COPD (including chronic bronchitis, emphysema and chronic airflow limitation).

The development of COPD occurs over many years and therefore the prevalence of COPD increases with age, mostly occurring in people aged 45 and over.

In 2022, 4.8% (496,000) of people aged 45 and over in Australia were estimated to be living with COPD (including chronic bronchitis, emphysema and chronic airflow limitation), according to self-reported data in the Australian Bureau of Statistics (ABS) National Health Survey (NHS) (AIHW analysis of ABS 2023).

The prevalence of COPD:

  • was the same for men and women in those aged 45 years and over (4.8%). For people aged 75 or over, COPD was more prevalent in men compared with women (8.3% and 5.4%, respectively)
  • increased gradually with age from 1.7% for people aged 45–54 to 7.0% for those aged 75 and over (Figure 1) (AIHW analysis of ABS 2023).

Data note: COPD prevalence estimates from the ABS NHS

In the 2022 NHS, COPD was captured as self-reported current and long-term bronchitis, emphysema or chronic airflow limitation. While chronic bronchitis and emphysema are common conditions resulting in COPD (Yang et al. 2025), not all people with chronic bronchitis or emphysema will meet the diagnostic criteria for COPD (Marsh et al. 2008), especially at younger ages. As such, in this report, COPD prevalence estimates from the NHS are reported for ages 45 and over to give a closer estimate of diagnosable COPD.

Trends over time

The prevalence of COPD in people aged 45 and over remained stable between 2001 (5.5%) and 2022 (4.8%) (Figure 1) (AIHW analysis of ABS 2023).

Figure 1: Prevalence of COPD (ages 45 and over), 2001 to 2022

Line chart shows the prevalence of COPD among people aged 45 and over remained stable between 2001 and 2022.

Line chart shows the prevalence of COPD among people aged 45 and over remained stable between 2001 and 2022.

Remoteness and socioeconomic areas

In 2022, the prevalence of COPD in those aged 45 and over:

  • was 7.3% for people living in Outer regional and Remote areas and 4.2% for people living in Major cities
  • was 9.0% for people living in areas of most socioeconomic disadvantage (lowest socioeconomic areas) and 2.4% for people living in the least disadvantaged areas (highest socioeconomic areas) (AIHW analysis of ABS 2023).

Measured prevalence estimates

COPD diagnosis in Australia typically requires the use of spirometry to measure the extent of airflow limitation (Yang et al. 2025). An Australian research collaboration with the international Burden of Obstructive Lung Disease (BOLD) study used spirometry testing and self-reported symptoms of breathlessness to identify people with COPD between 2006 and 2010 (Toelle et al. 2021). Using these data, weighted to the 2016 Australian Census, the study estimated that the prevalence of airflow limitation and clinical symptoms of breathlessness consistent with COPD was 4.4% among Australians aged 40 and over. 

The BOLD Australia study is considered a robust source of COPD prevalence estimates due to the use of spirometry data and objective classification criteria. However, studies like this are costly and not frequently updated which limits their use for routine disease monitoring.


Treatment and management of COPD

COPD is a progressive condition and there is currently no cure. Early diagnosis and treatment can slow disease progression and help to manage flare ups. 

The Department of Health, Disability and Ageing National Strategic Action Plan for Lung Conditions (the Action Plan) provides a detailed, person-centred roadmap for treating and managing COPD, among several other lung conditions. Priority areas include prevention by reducing exposure to common risk factors (tobacco smoke, occupational hazards), self-management support tools, stigma reduction, improved access to care and better translation of scientific knowledge (Department of Health, Disability and Ageing 2019). 

This plan is complemented by The COPD-X Plan: Australian and New Zealand Guidelines for the management of COPD (the COPD-X Guidelines) which outlines the latest evidence around optimal management of people with COPD (Yang et al. 2025). The COPD-X Guidelines emphasise the importance of several factors in optimal COPD management, including:

  • reducing risk factors, especially through smoking avoidance and cessation
  • multidisciplinary care to optimise daily function
  • treatment of comorbidities
  • pulmonary rehabilitation for people experiencing symptoms.

Best practice COPD care includes:

  • Early and accurate diagnosis with spirometry
  • A comprehensive care plan
  • Exacerbation prevention and management, including a COPD action plan (Lung Foundation Australia 2025).

Primary care for COPD

General practitioners and other primary care health professionals play an important role in the management of COPD in the community. This role includes diagnosis, prescription of regular medications, education, development of comprehensive care plans to prevent exacerbations and improve quality of life (Lung Foundation Australia, 2025).

There is currently no nationally consistent primary health care data collection to monitor provision of care by GPs. See General practice, allied health and other primary care services (AIHW 2025a).

Hospitalisations for COPD

  • In 2023–24, hospitalisation rates for COPD increased with age and were highest for people aged 80−84 (1,600 per 100,000 population).

  • In 2023–24, there were 159,000 hospitalisations with a principal or additional diagnosis (any diagnosis) of COPD, representing 1.3% of all hospitalisations.

Patients may require admission to hospital for severe acute exacerbations of COPD. These so-called ‘flare ups’ are frequently due to respiratory tract infections but have also been associated with increases in exposure to air pollution and changes in ambient temperature.

In 2023–24:

  • There were around 69,200 hospitalisations where COPD was the principal diagnosis, a rate of 255 per 100,000 population.
  • 98% (67,700) of COPD hospitalisations were among people aged 45 and over. The rate of COPD hospitalisations for people aged 45 and over was 620 per 100,000 population.
  • COPD accounted for 337,000 bed days, representing 1% of all bed days.
  • The average length of stay was 5.4 days and 88% of COPD hospitalisations were overnight stays.
  • Hospitalisation rates increased with age and were highest for people aged 80–84 (1,600 per 100,000 population) and were similar for males compared with females (245 and 265 per 100,000 population, respectively).

Trends over time

From 2014–15 to 2023–24, for COPD hospitalisations:

  • the rate decreased from 290 to 255 per 100,000 population
  • the proportion of overnight stays decreased slightly from 91% to 88%
  • the average length of overnight stays decreased slightly from 5.8 to 5.4 days (Figure 2).

Figure 2: COPD hospitalisations, age and sex (2023–24), trends over time (2014–15 to 2023–24)

Line chart shows a decrease in the crude rate of hospitalisations due to COPD between 2014–15 and 2023–24, from 290 to 255 per 100,000 population.

Line chart shows a decrease in the crude rate of hospitalisations due to COPD between 2014–15 and 2023–24, from 290 to 255 per 100,000 population.

Remoteness and socioeconomic areas

In 2023–24, the age-standardised rate of hospitalisation due to COPD (as the principal diagnosis):

  • was higher in Remote and Very remote areas (550 per 100,000 population) compared to Major cities (170 per 100,000 population).
  • was higher in areas of most socio-economic disadvantage (335 per 100,000 population) compared to areas of least socio-economic disadvantage (93 per 100,000 population).

Emergency department presentations for COPD

  • There were 61,500 ED presentations for COPD in 2024–25, a rate of 225 per 100,000 population.

  • In 2024–25, the rate of ED presentations (principal diagnosis) due to COPD was higher in areas of most socioeconomic disadvantage compared with areas of least socioeconomic disadvantage (400 and 80 per 100,000 population, respectively).

COPD exacerbations impact the natural progression of the disease, are responsible for the majority of costs, and are associated with high mortality. Patients with COPD often need emergency department (ED) visits or hospital admissions because of acute exacerbations that may progress to respiratory failure (Kumbhare et al. 2016).

Data from the National Non-Admitted Patient Emergency Department Care Database (NAPEDC) show that in 2024–25:

  • there were 61,500 (or 58,000 for 45 years and over) ED presentations with a principal diagnosis of COPD, about 225 (or 520 for 45 years and over) presentations per 100,000 population
  • ED presentation rates were higher for females (235 per 100,000 population) compared with males (215 per 100,000 population), or 520 (females) and 510 (males) for 45 years and over.

Trends over time

The rate of ED presentation for COPD was similar in 2018–19 (230 per 100,000 population) and 2024–25 (225 per 100,000 population), or 540 (2018–19) and 520 (2024–25) for people aged 45 and over.

The presentation rate declined to 175 during the height of the COVID–19 pandemic over the period 2020–21 and 2021–22 (or 395 for people aged 45 and over) (Figure 3).

Figure 3: Emergency department presentations due to COPD, age and sex (2024–25), trends over time (2018–19 to 2024–25)

Line chart shows the crude rate of ED presentations due to COPD between 2018–19 and 2024–25 remained relatively stable.

Line chart shows the crude rate of ED presentations due to COPD between 2018–19 and 2024–25 remained relatively stable.

Remoteness and socioeconomic areas

In 2024–25, the rate of ED presentations due to COPD as the principal diagnosis:

  • was higher in Remote and very remote areas (570 per 100,000 population) compared to Major cities (170 per 100,000 population)
  • was highest in areas of most socioeconomic disadvantage (400 per 100,000 population), and lowest in areas of least socioeconomic disadvantage (80 per 100,000 population).  

Impact of COPD

COPD can interrupt daily activities, sleep patterns and the ability to exercise. People with COPD generally rate their health worse than people without the condition (Lung Foundation 2022).

The natural environment has the ability to affect health outcomes, particularly for people living with chronic respiratory conditions due to the impact on air quality. See The natural environment and chronic respiratory conditions.

Burden of disease due to COPD

  • In 2024, COPD accounted for 3.7% of total disease burden, 3.2% of non-fatal burden and 4.1% of fatal burden.

In 2024, COPD was the fifth leading cause of burden and accounted for 3.7% of total burden, 3.2% of non-fatal burden and 4.1% of fatal burden.

Within the respiratory disease group, COPD accounted for:

  • 51% of total burden (disability-adjusted life years or DALY)
  • 38% of non-fatal burden (years lived with a disability or YLD)
  • 72% of fatal burden (years of life lost or YLL) (AIHW 2024).

In 2024:

  • disease burden due to COPD increased with increasing age, and the proportion of total burden was higher for females than males (54% and 46%, respectively)
  • COPD was the leading cause of burden for people aged 70–74.

Trends over time

After adjusting for different population age structures over time, the rate of burden from COPD changed little (6.6 to 5.7 DALY per 1,000 population) between 2003 and 2024 (Figure 4).

Figure 4: Burden of disease due to COPD, 2003 to 2024

Line chart shows the age-standardised rate of total disease burden due to COPD changed little between 2003 and 2024.

Line chart shows the age-standardised rate of total disease burden due to COPD changed little between 2003 and 2024.

Burden attributable to risk factors

In 2024, two thirds (65%) of the total disease burden from COPD was attributable to tobacco use, 7% was attributable to air pollution, and 2% to occupational exposures and hazards. Three quarters (74%) of total disease burden from COPD could have been prevented by reducing exposure to these risk factors, preventing a loss of 157,000 DALY.

For more information, see the Australian Burden of Disease Study 2024.

Remoteness and socioeconomic areas

At the time of release there were no 2024 data on disease burden disaggregated by socioeconomic and remoteness areas.

In 2018, after adjusting for age differences, the rate of burden from COPD:

  • was highest for people living in Remote and Very remote areas and lowest for people living in Major cities (8.5 and 5.2 DALY per 1,000 population, respectively)
  • was highest for people living in areas of most socioeconomic disadvantage (lowest socioeconomic areas) and lowest for people living in the least disadvantaged areas (highest socioeconomic areas) (7.5 and 4.3 DALY per 1,000 population, respectively) (AIHW 2021a).

For more information, see the Australian Burden of Disease Study 2018: Interactive data on disease burden.

Health system expenditure for COPD

  • In 2023–24, an estimated $1.8 billion of expenditure in the Australian health system was attributed to COPD (30% of all respiratory condition expenditure).

Understanding the contribution of COPD to direct health care expenditure helps to explain its economic impact.

In 2023–24:

  • the age distribution of spending on COPD reflects the prevalence distribution, with most spending on people aged 45 and over (98%)
  • over one-third (34%) of COPD spending was on those aged 70–79
  • spending on COPD was higher for males ($913.0 million), compared with females ($837.7 million) (AIHW 2025b).

Where is the money spent?

Figure 5 shows the breakdown of expenditure due to COPD with the highest category being for admitted patients at public hospitals ($1.0 billion).

In 2023–24, expenditure on COPD was comprised of:

  • hospital services, representing 77% ($1.4 billion) of COPD expenditure
  • primary health care, representing 19% ($326.3 million) of COPD expenditure
  • referred medical services, representing 4.2% ($73.6 million) of COPD expenditure.

Figure 5: COPD spending breakdown, 2023–24

Pie chart shows public hospital admitted patient spending was the largest spending category for COPD in 2023–24.

Trends over time

Over the period from 2013–14 to 2023–24:

  • total spending on COPD increased from around $1.0 billion to $1.8 billion (in current prices – unadjusted for inflation) (an increase of $711 million)
  • after adjusting for the effects of inflation, real expenditure on COPD grew $355.9 million (constant prices) (Figure 6).

Figure 6: Health system expenditure for COPD, 2013–14 to 2023–24

Line chart shows the increase in health system expenditure for COPD between 2013–14 and 2023–24, with one line showing constant prices and the other line showing current prices.


Source: AIHW Disease Expenditure database

Expenditure per case of COPD

In 2023–24, it was estimated that COPD health spending per case was:

  • 18% higher for males compared with females ($2,700 and $2,300 per case, respectively)
  • higher than respiratory conditions as a group ($2,500 and $775 per case, respectively).

After adjusting for inflation, average health spending on COPD per case declined between 2015–16 ($2,900) and 2023–24 ($2,500) (AIHW 2025c).

COPD expenditure attributable to risk factors

In 2023-24, 72% of $1.8 billion of health system spending on COPD could be attributed to specific risk factors, of which:

  • $1.1 billion (62%) was attributable to tobacco use
  • $120.1 million (6.9%) was attributable to air pollution
  • $46.4 million (2.6%) was attributable to occupational exposures and hazards (AIHW 2025c).

Remoteness and socioeconomic areas

In 2023–24, the rate of health spending for COPD increased with increasing remoteness, being highest for Very remote areas ($15.9 million per 100,000 population) and lowest for Major cities ($5.2 million per 100,000 population) (AIHW 2025c).

There were no data on health spending disaggregated by socioeconomic areas.

For more information, see:

Deaths due to COPD

  • In 2023, COPD mortality represented 4.1% (as the underlying cause) and 9.8% (as the underlying and/or associated cause) of all deaths.

In 2023, COPD was recorded as the underlying cause of 7,437 deaths (28 per 100,000 population), and an associated cause of 10,534 deaths (40 per 100,000 population).

In 2023, COPD mortality (as the underlying cause of death):

  • was more common amongst people aged 75 and over (67% of COPD deaths)
  • was similar between males (53%) and females (47%).


Trends over time

After adjusting for different population age structures over time, mortality rates for COPD (as the underlying cause of death) between 2013 and 2023:

  • fluctuated between 19 and 25 per 100,000 population
  • were higher for males compared with females (Figure 7).

Figure 7: Deaths due to COPD, 2013 to 2023

Line chart shows the age-standardised mortality rate due to COPD as the underlying cause of death fluctuated between 19 and 25 per 100,000 population between 2013 and 2023.

Line chart shows the age-standardised mortality rate due to COPD as the underlying cause of death fluctuated between 19 and 25 per 100,000 population between 2013 and 2023.

Remoteness and socioeconomic areas

In 2023, after adjusting for age differences, mortality rates for COPD (as the underlying cause) were:

  • higher for people living in Remote and Very remote areas compared with people living in Major cities (35 and 17 per 100,000 population, respectively)
  • higher for people living in areas of most socioeconomic disadvantage compared with people living in the least disadvantaged areas (30 and 11 per 100,000 population, respectively).

The same patterns were observed for deaths with COPD recorded as either an underlying cause or associated cause of death.

Comorbidities of COPD

People living with COPD often also live with other long-term conditions, known as ‘comorbidity’. Having a comorbid chronic condition can mean that people have complex health needs and poorer overall quality of life (AIHW 2021b).

According to the NHS, in 2022, 88% (438,100) of people aged 45 and over with COPD (including chronic bronchitis, emphysema and chronic airflow limitation) also had one or more other chronic conditions (AIHW analysis of ABS 2023). Of those aged 45 and over with COPD, the top 4 comorbidities were:

  • arthritis (54%)
  • mental and behavioural conditions (45%)
  • back problems (45%)
  • asthma (42%).

For more information on chronic conditions and multimorbidity, see Multimorbidity in Australia.

First Nations people

COPD is a major cause of poor health and death for Aboriginal and Torres Strait Islander (First Nations) people.

For more information about First Nations people with respiratory conditions, see Aboriginal and Torres Strait Islander Health Performance Framework Measure 1.04 (AIHW 2025e).

How common is COPD among First Nations people?

An estimated 5.4% (12,400) of First Nations people aged 45 and over were living with COPD in 2022–23, according to self-reported data in the National Aboriginal and Torres Strait Islander Health Survey (NATSIHS) (AIHW analysis of ABS 2024a). The prevalence of COPD was similar among males and females (5.8% and 5.2%, respectively).

Data note: Trends in COPD prevalence among First Nations people

In the NATSIHS, COPD is captured as self-reported current and long-term bronchitis, emphysema or chronic airflow limitation. In the 2022–23 NATSIHS, emphysema was removed from survey prompt cards which may have contributed to a decline in estimated COPD prevalence for 2022–23. COPD prevalence estimates are therefore not directly comparable with previous NATSIHS surveys and unable to be used to report trends in COPD prevalence (ABS 2024b).

Hospitalisations among First Nations people

In 2023–24:

  • there were around 6,600 hospitalisations where COPD was the principal diagnosis among First Nations people, a rate of 640 per 100,000 population
  • after adjusting for differences in age, the hospitalisation rate among First Nations people was 5.8 times the rate among non-Indigenous Australians.

Emergency department presentations among First Nations people

In 2024–25:

  • there were around 7,600 ED presentations where COPD was the principal diagnosis among First Nations people, with a rate of 730 per 100,000 population
  • the rate of COPD ED presentations was higher among First Nations women than men (870 and 580 per 100,000 population, respectively)
  • after adjusting for age differences, the rate among First Nations people was 7.3 times the rate among non-Indigenous Australians.

Burden of disease among First Nations people

In 2018, COPD was the 6th leading cause of total disease burden among First Nations people (AIHW 2022). COPD accounted for 3.4% of total disease burden (DALY), 2.7% of non-fatal burden (YLD) and 4.2% of fatal burden (YLL) for First Nations people in 2018 (AIHW 2022).

Deaths among First Nations people

In 2023:

  • there were 348 deaths where COPD was recorded as the underlying cause of death among First Nations people, with a rate of 34 per 100,000 population
  • after adjusting for differences in age, the rate among First Nations people was 3.1 times the rate among non-Indigenous Australians.

According to the 2018 Australian Burden of Disease Study, tobacco use contributed to 73% of total disability-adjusted life years (DALY) for COPD. The proportion of COPD DALY attributed to tobacco use was higher among females compared with males (79% and 66%, respectively) (AIHW 2021a).

The main risk factor for the development and progression of COPD is smoking, with smokers in the United States being 12 to 13 times more likely to die from COPD than non-smokers (U.S. Department of Health and Human Services 2014).

Improvements in COPD mortality rates tend to follow decreases in smoking rates, with a time-lag in-between due to the long latency period of COPD (smoking early in life is involved in initiating disease processes prior to the disease being diagnosed) (Laniado-Laborín 2009).

In Australia, the smoking rate of adults aged 18 and over decreased from 1980 to 2019 for both men and women, with men having consistently higher smoking rates than women (men: 41% to 14%, women: 30% to 12%) (Greenhalgh et al. 2023) (Figure 8).

For more information on the history of smoking and COPD, see Mortality from asthma and COPD in Australia (AIHW 2014).

Figure 8: COPD death rates of people aged 45 and over, 3-year moving average, and smoking rates, 1980 to 2020
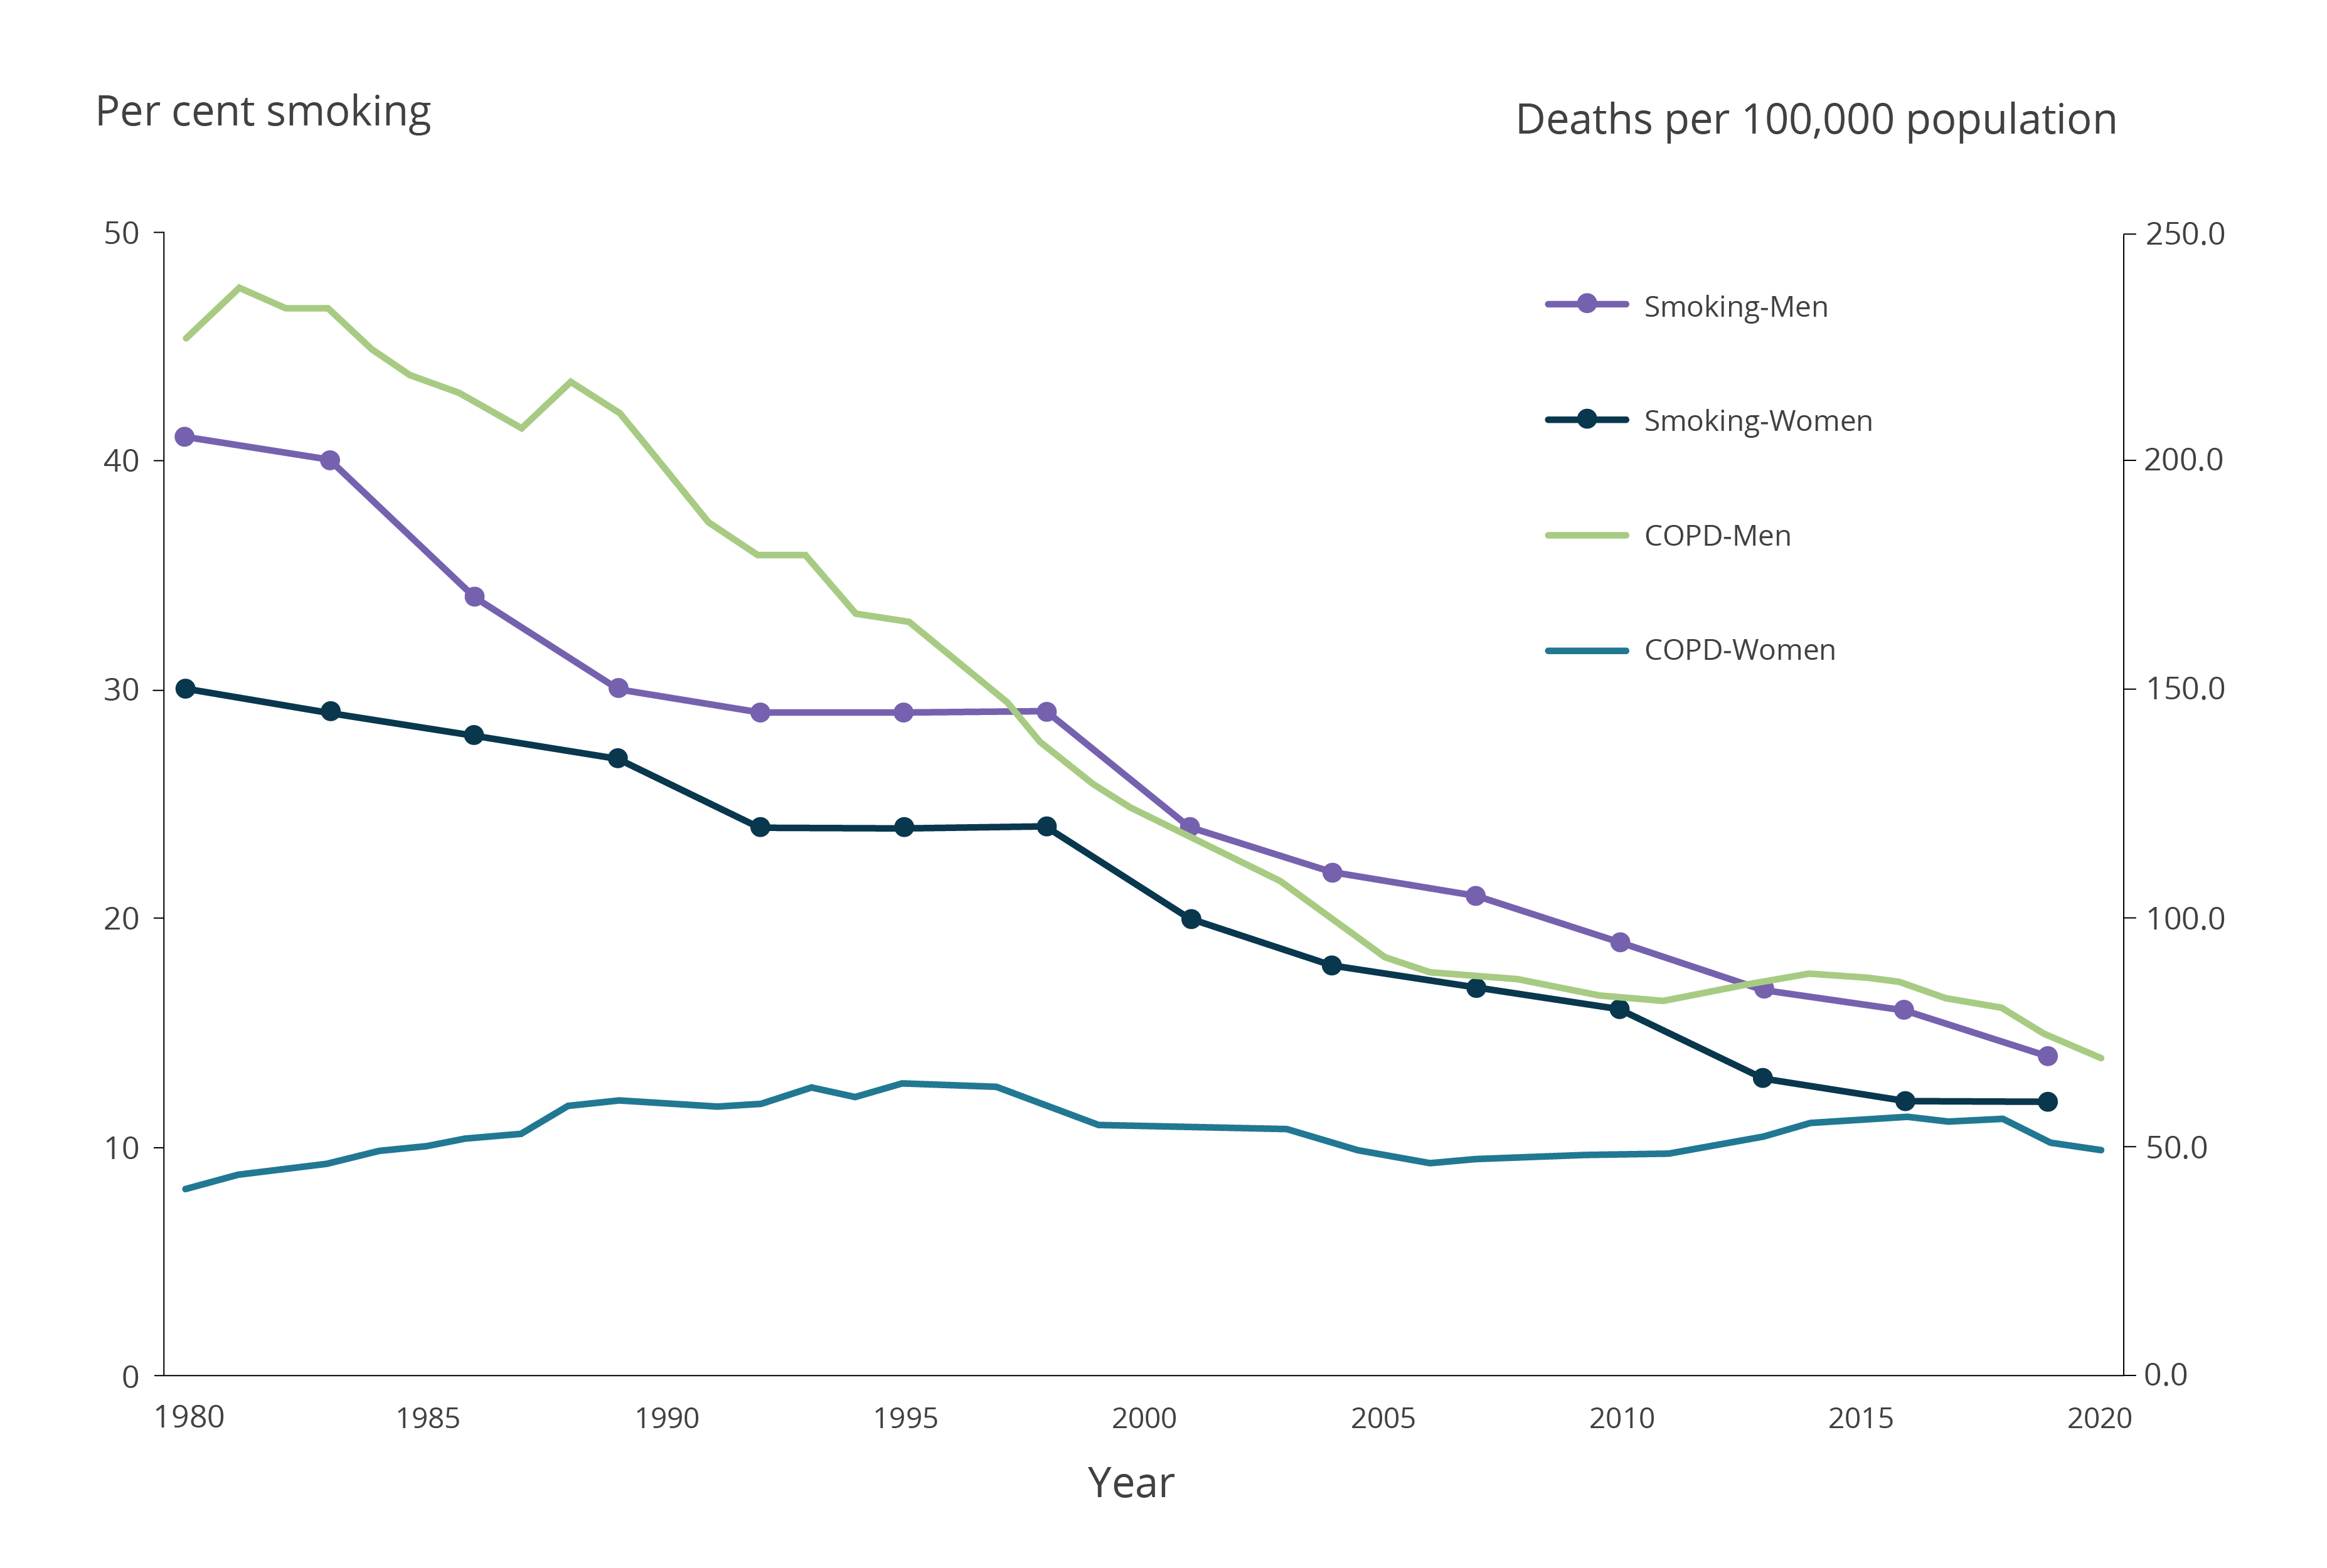
Line chart shows a decrease in smoking rates between 1980 and 2020 for men and women, alongside a decrease in mortality due to COPD for men. Mortality due to COPD among women remained more stable.

Notes:

  1. COPD deaths are shown as a 3-year moving average. For example, the 2020 data point represents the average of 2019, 2020 and 2021.
  2. From 1979 to 1996, COPD classified according to ICD-9 codes 490, 491, 492, 496. From 1997 to 2021, COPD classified according to ICD-10 codes J40–J44.
  3. Smoking refers to people those reporting that they smoke 'daily' or 'at least weekly', and smoking any combination of combustible cigarettes, cigars, pipes or water pipes. It does not include use of electronic cigarettes/vapes or other personal vaporising devices where users inhale vapour rather than smoke. 
  4. Smoking data were calculated by the Cancer Council of Victoria. Smoking rates for 1980–1992 were sourced from surveys conducted by the Anti-Cancer Council of Victoria. Smoking rates for 1995–2019 were sourced from the National Drug Strategy Household Survey.
  5. Deaths registered in 2018 and earlier are based on the final version of cause of death data. Deaths registered in 2019 are based on the revised version and deaths registered in 2020 and 2021 are based on the preliminary version. Revised and preliminary versions are subject to further revision by the Australian Bureau of Statistics (ABS).

Source: AIHW analysis of the AIHW National Mortality Database, Greenhalgh et al. 2023.


Data