Risk factors for maternal death
Maternal age
The age-specific maternal mortality ratio measures the number of deaths to women of a specified age group per 1,000 women giving birth in that age group. Age-specific maternal mortality rates are measured against the known population age distribution and are measured per 100,000 women in the population.
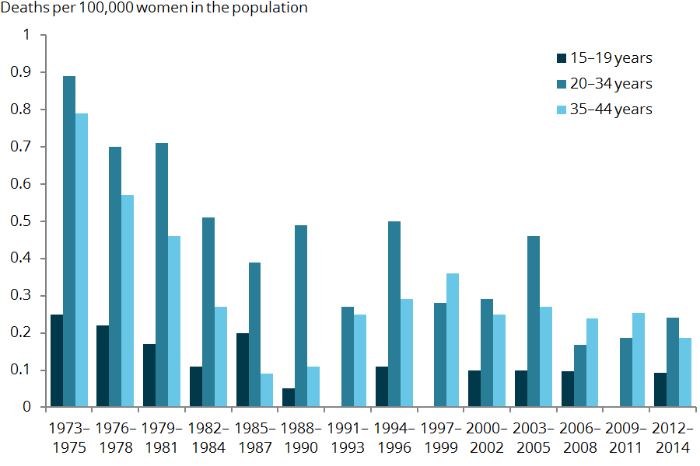
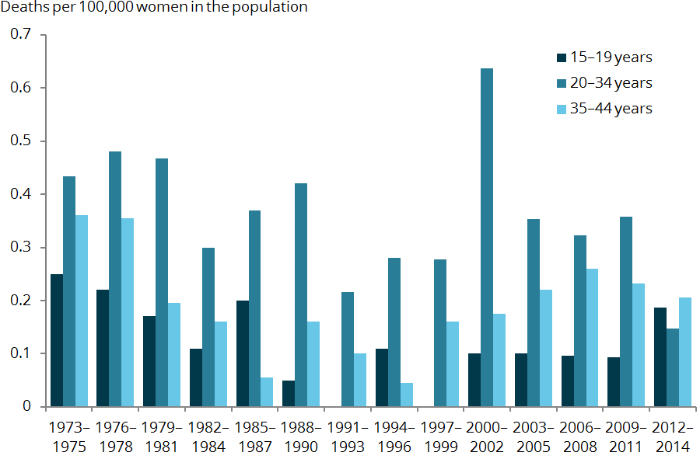
Figures 8 and 9 illustrate changes in direct and indirect maternal mortality rates for specific age groups over time.
The direct age-specific maternal mortality rate (Figure 8) for women aged 20–34 years, who are the majority of child-bearing women, has reduced from 0.9 per 100,000 women in the population in 1973–1975 to 0.2 per 100,000 women in the population in 2008–2012 (a 78% reduction). The similar figures for women aged less than 20 years are 0.3 per 100,000 women in the population in 1973–1975 to 0.2 per 100,000 women in the population in 2008–2012, and for women aged 35 or more are 0.8 per 100,000 women in the population in 1973–1975 to 0.2 per 100,000 women in the population in 2008–2012 (a 78% reduction).
Figure 8: Age-specific direct maternal mortality rate, Australia, 1973–2014
The indirect age-specific maternal mortality rate trends have shown significant variation in between those years (Figure 9). The rate for women aged 20–34 years has reduced from 0.4 per 100,000 women in the population in 1973–1975 to 0.2 per 100,000 women women in the population in 2008–2012. The similar figures for women aged less than 20 years are 0.3 per 100,000 women in the population in 1973–1975 to 0.2 per 100,000 women women in the population in 2008–2012, and for women aged 35 or more are 0.4 per 100,000 women in the population in 1973–1975 to 0.2 per 100,000 women in the population in 2008–2012.
Figure 9: Age-specific indirect maternal mortality rate, Australia, 1973–2014
Parity
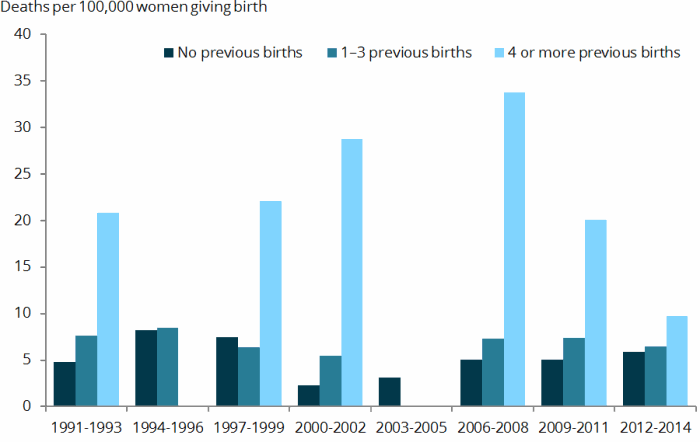
Parity refers to a woman’s number of previous pregnancies carried to a viable gestational age (usually 20 weeks), resulting in live births or stillbirths and excluding the current pregnancy.
Though there appear to be some differences between women of lower and higher parity, these differences are small and may not be significant.
Figure 10: Maternal mortality ratio by maternal parity, Australia, 1991–2014
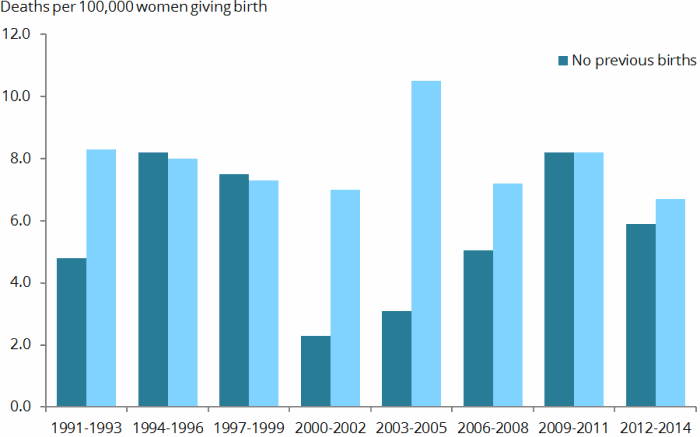
Figure 11: Maternal parity vs. maternal mortality ratio, Australia, 1991–2014
Aboriginal and Torres Strait Islander women
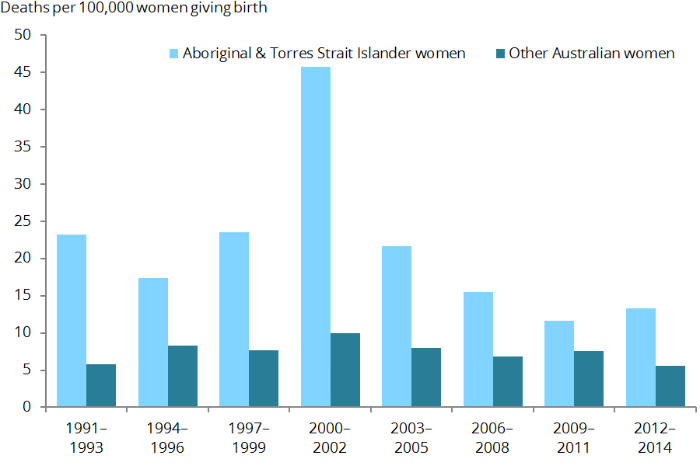
Aboriginal and Torres Strait Islander women are significantly more likely to die in association with pregnancy and childbirth than other Australian women. The differential between the MMRs appears to be decreasing. However, care must be taken when observing this decrease due to small numbers.
The relationship between Indigenous status and MMR is shown in figure 12. Indigenous status has been collected for women categorised as direct maternal deaths since 1970, and for indirect maternal deaths and incidental deaths since 1991. In 1991–1993 the MMR for Aboriginal and Torres Strait Islander women was 4 times that of other Australian women (23.3 per 100,000 women giving birth versus 5.8 per 100,000 women giving birth). In 2012–2014 the MMR for Aboriginal and Torres Strait Islander women was 2.4 times that of other Australian women (13.3 per 100,000 women giving birth versus 5.6 per 100,000 women giving birth).
Figure 12: Maternal mortality ratios by Indigenous status, Australia, 1991–2014
