Demographic profile
This page presents an overview of the demographic characteristics of older Australians, including changes over time and population projections. Throughout this page, ‘older people’ refers to people aged 65 and over. Where this definition does not apply, the age group in focus is specified. The ‘Older Aboriginal and Torres Strait Islander people’ feature article defines older people as aged 50 and over. This definition does not apply to this article, with Indigenous Australians aged 50–64 not included in the information presented.
Australia’s older population
Australia’s population is ageing due to increasing life expectancy and declining fertility rates. Both the number of people at the older ages is growing and older people are representing an increasing share of the total population (CEPAR 2021).
Recent data show that:
- At 30 June 2020, there were an estimated 4.2 million older Australians (aged 65 and over) with older people comprising 16% of the total Australian population (ABS 2020b).
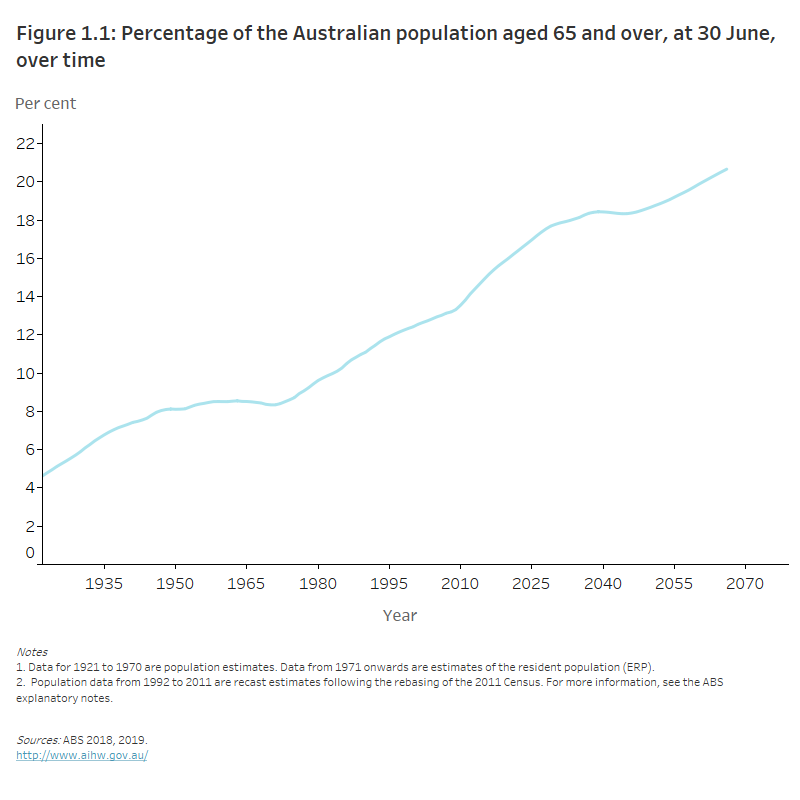
- The number of older Australians has increased from 1.0 million (8.3% of the total population) in 1970 and 2.1 million (12%) in 1995 (Figure 1.1) (ABS 2019).
- The number and percentage of older Australians is expected to continue to grow. By 2066, it is projected that older people in Australia will make up between 21% and 23% of the total population (ABS 2018).
- For those aged 85 and over, the proportion has increased from 0.5% (63,200) in 1970, to 1.1% (190,400) in 1995, to 2.1% at 30 June 2020 (528,000). The proportion is expected to continue to rise to between 3.6% and 4.4% in 2066 (ABS 2018, 2020a).
Figure 1.1: Percentage of the Australian population aged 65 and over, at 30 June, over time
The line graph shows that the percentage of the Australian population aged 65 and over has increased, from 4.6% in 1922 to 16.2% in 2021. The percentage of older Australians in the population is set to continue increasing to approximately 20.7% in 2066, with particular growth between 2009 and 2029.

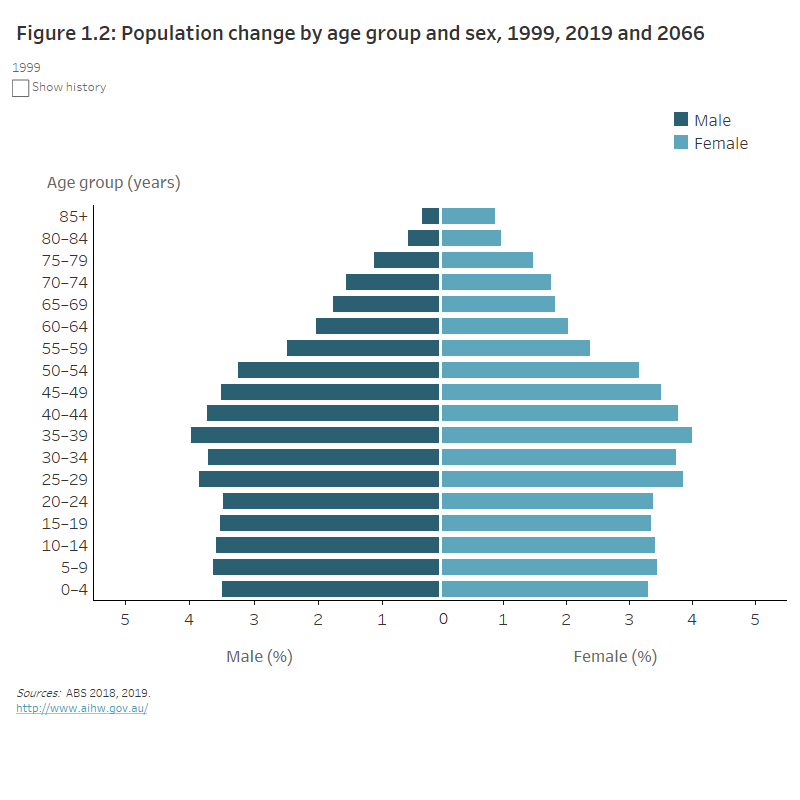
Figure 1.2: Population change by age group and sex, 1999, 2019 and 2066
The butterfly chart shows that the percentage of older men and women has increased between 1999 and 2019. In 1999, 5.4% of men were aged over 65, compared to 7.4% in 2019. The percentage of older females also increased from 6.9% to 8.4%. The percentage of older men and women is projected to increase to 9.8% and 10.8% in 2066 for men and women respectively.

As Australia’s population ages, the age profile of the older population is also projected to change. By 2066, it is projected:
- There will be just over 4.5 million people aged 65–74.
- People aged 75–84 will account for one-third (34%, 3.5 million) of the older population.
- 1 in 5 older people will be aged 85 and over (21%, 2.2 million) (ABS 2018).
Sex
At 30 June 2020, over half (53%) of older Australians (aged 65 and over) were women. There were an estimated 2.2 million women and almost 2.0 million men aged 65 and over (ABS 2020b).
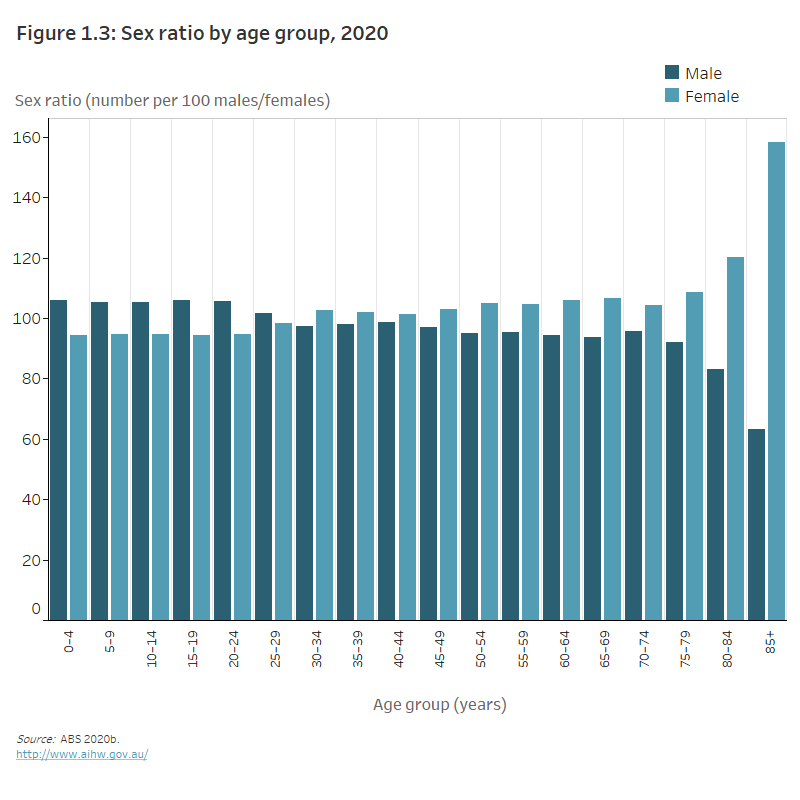
Women tend to live longer than men. This is seen in the differences in life expectancy and is particularly apparent in the older age groups. The sex ratio at older ages reflects the higher male mortality of the older Australian population. At 30 June 2020, there were 88.1 older males (aged 65 and over) for every 100 older females (see Figure 1.3).
Figure 1.3: Sex ratio by age group, in 2020
The column graph shows there is a larger proportion of men than women in younger age groups (0 to 29 years) and a greater proportion of women in older age groups (30 years and over). The differences in proportion of females in each age group becomes more pronounced in older age groups, reflecting the longer life expectancy of women (there were 158.3 females per 100 males aged 85 and over in 2020).

The proportion of women in the older age groups peaked in 1968, when women made up 58% of all people aged 65 and over in Australia. This proportion has been declining since. The peak for women aged 65–74 was in 1965 (56%) and for those aged 75–84 in 1974 (63%); for women aged 85 and over, it peaked in 1982 (73%). These patterns relate in large part to the effects of World War II.
Geographical distribution
At 30 June 2020, Tasmania (20%) had the highest proportion of its population aged 65 and over, followed by South Australia (19%) and New South Wales (17%). Considering older age groups, the state with the highest proportion of people aged 85 and over in its population was South Australia (2.6%). Similar proportions were reported for Tasmania (2.3%), New South Wales (2.2%) and Victoria (2.1%) (ABS 2020b).
Another way to consider the geographical distribution of older people is to look at the median age (the age at which half the population is older and half is younger) of smaller regions, such as Statistical Areas Level 4 (SA4s) within the Australian Statistical Geography Standard (ASGS). In 2019, the Hunter Valley (excluding Newcastle) in New South Wales had the highest median age (63.0), followed by the Mid North Coast in New South Wales (61.2) and Moreton Bay – North in Queensland (60.6) (ABS 2020c).
International comparisons
Like many developed countries, Australia has a high median age, with a relatively large proportion of its population aged 65 and over. In 2020, the median age in Australia was estimated at 37.9. This was slightly lower than for the United States of America (38.3 years) and the United Kingdom (40.5 years). It was slightly higher than other Organisation for Economic Co-operation and Development (OECD) countries such as Turkey (31.5), Israel (30.5) and Mexico (29.2) (UN 2019).
The median age of the overseas-born population in Australia has decreased over the last 10 years, but increased slightly at 30 June 2020. The decrease before 30 June 2020 has slowed the ageing of the total Australian population (ABS 2021).
The estimated proportion of people aged 65 and over in these countries in 2020 was similar to Australia’s (16%):
- 17% in the United States of America
- 19% in the United Kingdom.
This proportion was higher than a number of other OECD countries, including:
- 12% in Israel
- 9% in Turkey
- 7.6% in Mexico (UN 2019).
Where do I go for more information?
For more information on the demographic profile of older Australians, see:
- ABS Census of Population and Housing: reflecting Australia – stories from the Census, 2016 Ageing population
- United Nations World population prospects 2019
Information about culturally and linguistically diverse, rural and remote and Aboriginal and Torres Strait Islander older Australians can be found in the feature articles, while information about deaths and life expectancy can be found in health status and functioning.
ABS (Australian Bureau of Statistics) 2018. Population projections, Australia. ABS cat. no. 3222.0. Canberra: ABS. Viewed 2021.
ABS 2019. Historical population, 2016. ABS cat. no. 3105.0.65.001. Canberra: ABS. Viewed 2021.
ABS 2020a. Australian Demographic Statistics, December 2019. ABS cat. no. 3101.0. Canberra: ABS. Viewed 2021.
ABS 2020b. National, state and territory population. ABS cat. no. 3101.0. Canberra: ABS. Viewed 2021.
ABS 2020c. Regional population by age and sex, Australia, 2019. ABS cat. no. 3235.0. Canberra: ABS. Viewed 2021.
ABS 2021. Migration, Australia 2019–20. ABS cat. no. 3412.0. Canberra: ABS. Viewed 2021. Viewed 2021.
CEPAR (ARC Centre of Excellence in Population Ageing Research) 2021. Population Ageing Futures Data Archive. Sydney: CEPAR. Viewed 11 March 2021.
UN (United Nations) 2019. World population prospects 2019. New York: UN. Viewed 11 March 2021.


