Diagnostic imaging services
Almost 2 in 5 Australians (39% or over 10 million people) received more than 27 million Medicare-subsidised diagnostic imaging services in 2022–23. Between 2018–19 and 2022–23, there was a relative increase in the proportion of the population who had a diagnostic imaging service (1.2%), in the number of services per 100 people (3.5%), and in the Medicare benefits paid (16.6%) (Table 3).
Measure | 2018–19 | 2022–23 |
|---|---|---|
Percentage of people(a) who had a diagnostic imaging service | 39% | 39% |
Number of diagnostic imaging services per 100 people(a) | 103 per 100 people | 106 per 100 people |
Total Medicare benefits paid for diagnostic imaging services per 100 people(a)(b) | $14,285 per 100 people | $16,649 per 100 people |
Notes:
- The numerator is the number of people who had a diagnostic imaging service and the denominator is the ABS ERP.
- Expenditure results are not adjusted for inflation.
Sources: AIHW analysis of Department of Health and Aged Care, MBS claims data; ABS ERP.
Use of diagnostic imaging services varies across PHN areas
The proportion of people who received a Medicare-subsidised diagnostic imaging service was lower in regional Primary Health Networks (PHN) ranging from 26% to 43%, compared to metropolitan PHNs where it ranged from 31% to 46% (Figure 5).
Figure 5: Proportion of people who had a Medicare-subsidised diagnostic imaging service, by PHN area, 2022–23
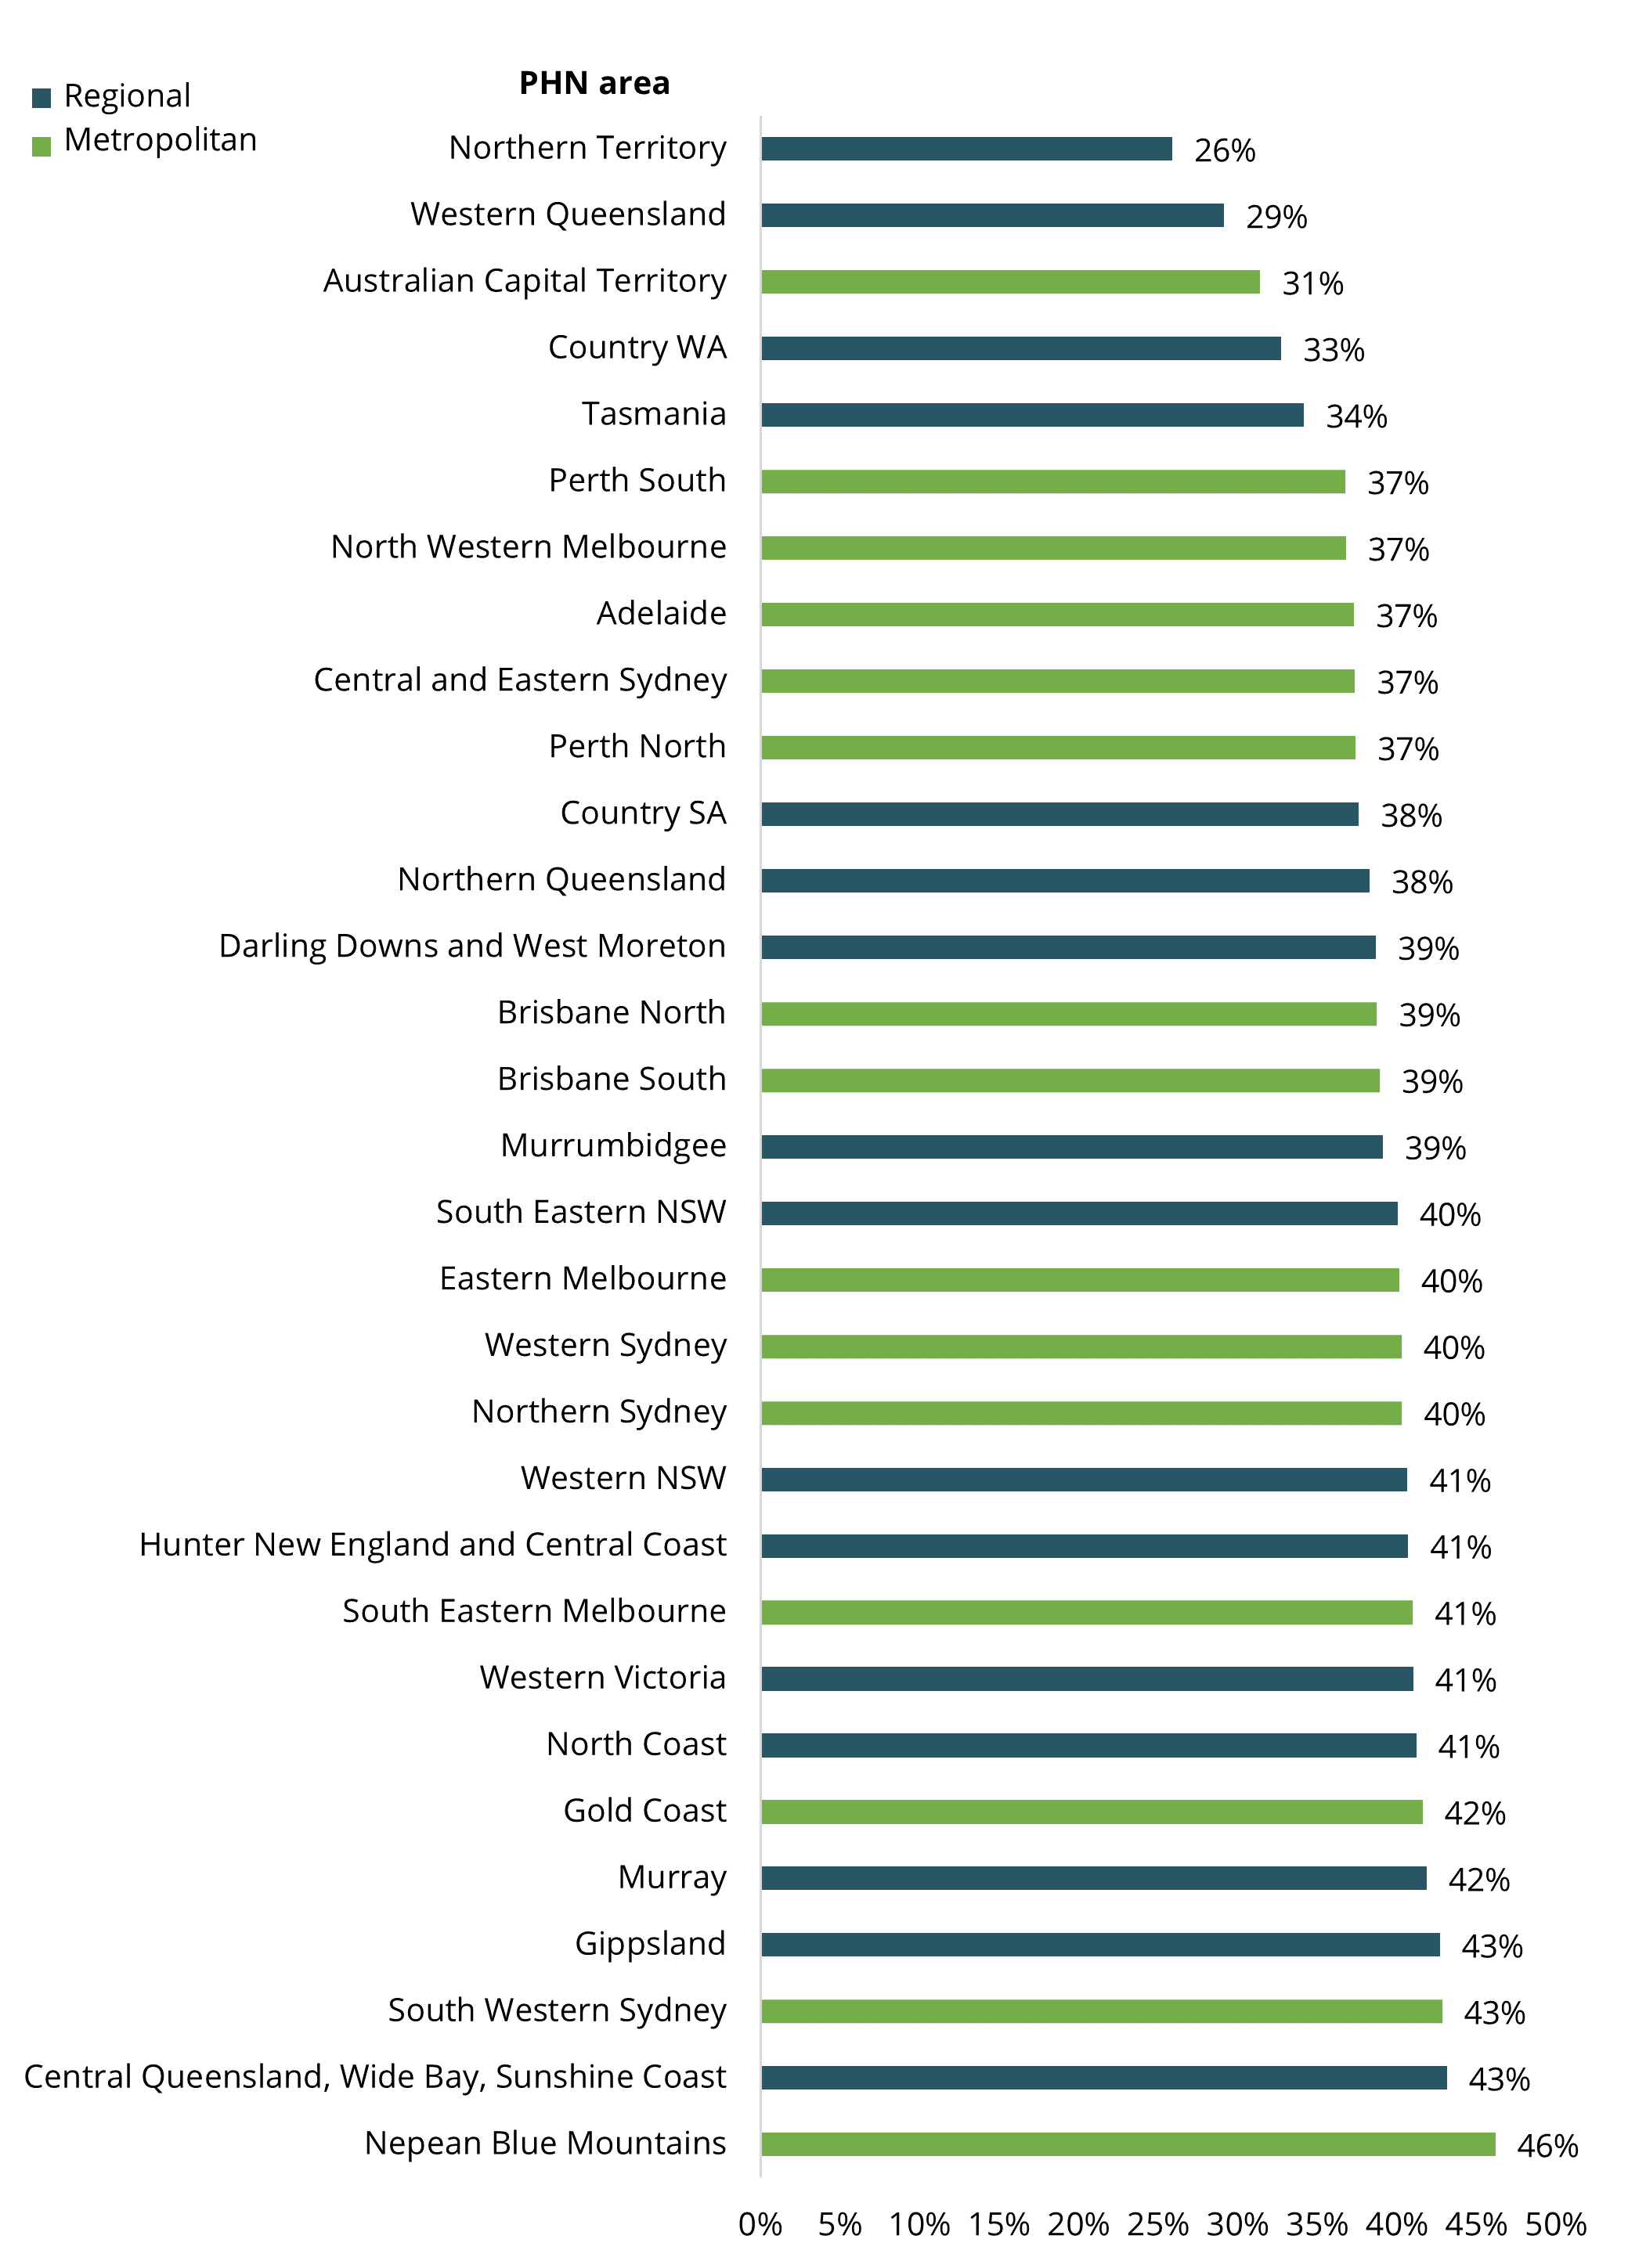
Chart: AIHW. Sources: AIHW analysis of Department of Health and Aged Care, Medicare Benefits claims data; ABS ERP.