Enhanced primary care
Almost 1 in 4 people had an Enhanced Primary Care GP attendance
People living with complex health conditions, including chronic or terminal medical conditions may receive Medicare-subsidised chronic disease management services from their GP for the diagnosis, treatment, planning, review and coordination of their care.
Over 6 million people (24% of Australians) received a Medicare-subsidised GP Enhanced Primary Care attendance in 2022–23 (Table 2).
Box 1: GP Enhanced Primary Care
In this report, GP Enhanced Primary Care refers to a range of services such as health assessments, medication management reviews, the creation and review of treatment plans, and coordination of care for people living with complex health conditions who require multidisciplinary, team-based care from a GP and at least 2 other providers. For more information, see Technical information.
Enhanced Primary Care services(b)(c) | 2018–19 (%) | 2022–23 (%) |
|---|---|---|
Chronic Disease Management Plan | 15.0 | 15.8 |
Mental Health | 8.8 | 8.3 |
Health Assessments | 4.2 | 4.9 |
Multidisciplinary Case Conference | 0.2 | 0.2 |
Medication Management Review (domiciliary) | 0.3 | 0.3 |
Medication Management Review (residential) | 0.3 | 0.3 |
Total Enhanced Primary Care(c) | 23.6 | 24.2 |
Note:
- In this report, GP Enhanced Primary Care refers to a range of non-hospital Medicare-subsidised services such as health assessments, medication management reviews, the creation and review of treatment plans, and coordination for people living with complex health conditions who require multidisciplinary, team-based care from a GP and at least 2 other providers.
- Refer to Technical information for details on MBS items and description of service groups.
- People may receive services from more than one subgroup within GP Enhanced Primary Care, but are only counted once in the total.
Sources: AIHW analysis of Department of Health and Aged Care, MBS claims data; ABS ERP.
Higher use of GP Enhanced Primary Care service in regional PHN areas
The proportion of people who had a GP Enhanced Primary Care service was higher for those who live in regional Primary Health Network (PHN) areas (26%) than those in metropolitan areas (23%) (Figure 3).
Box 2: PHN and Statistical Area Level 3 (SA3) geographical groupings
To support comparisons between similar geographical areas, PHNs are grouped into metropolitan and regional PHN areas. Results for SA3s are grouped by similar socioeconomic status (higher, medium and lower) for SA3s in Major cities, and by remoteness areas for SA3s in Inner Regional, Outer regional and Remote areas. For more information, see Technical Note – Geography.
Figure 3: Proportion of people who had a Medicare-subsidised GP Enhanced Primary Care service, by Primary Health Network (PHN) area, 2022–23
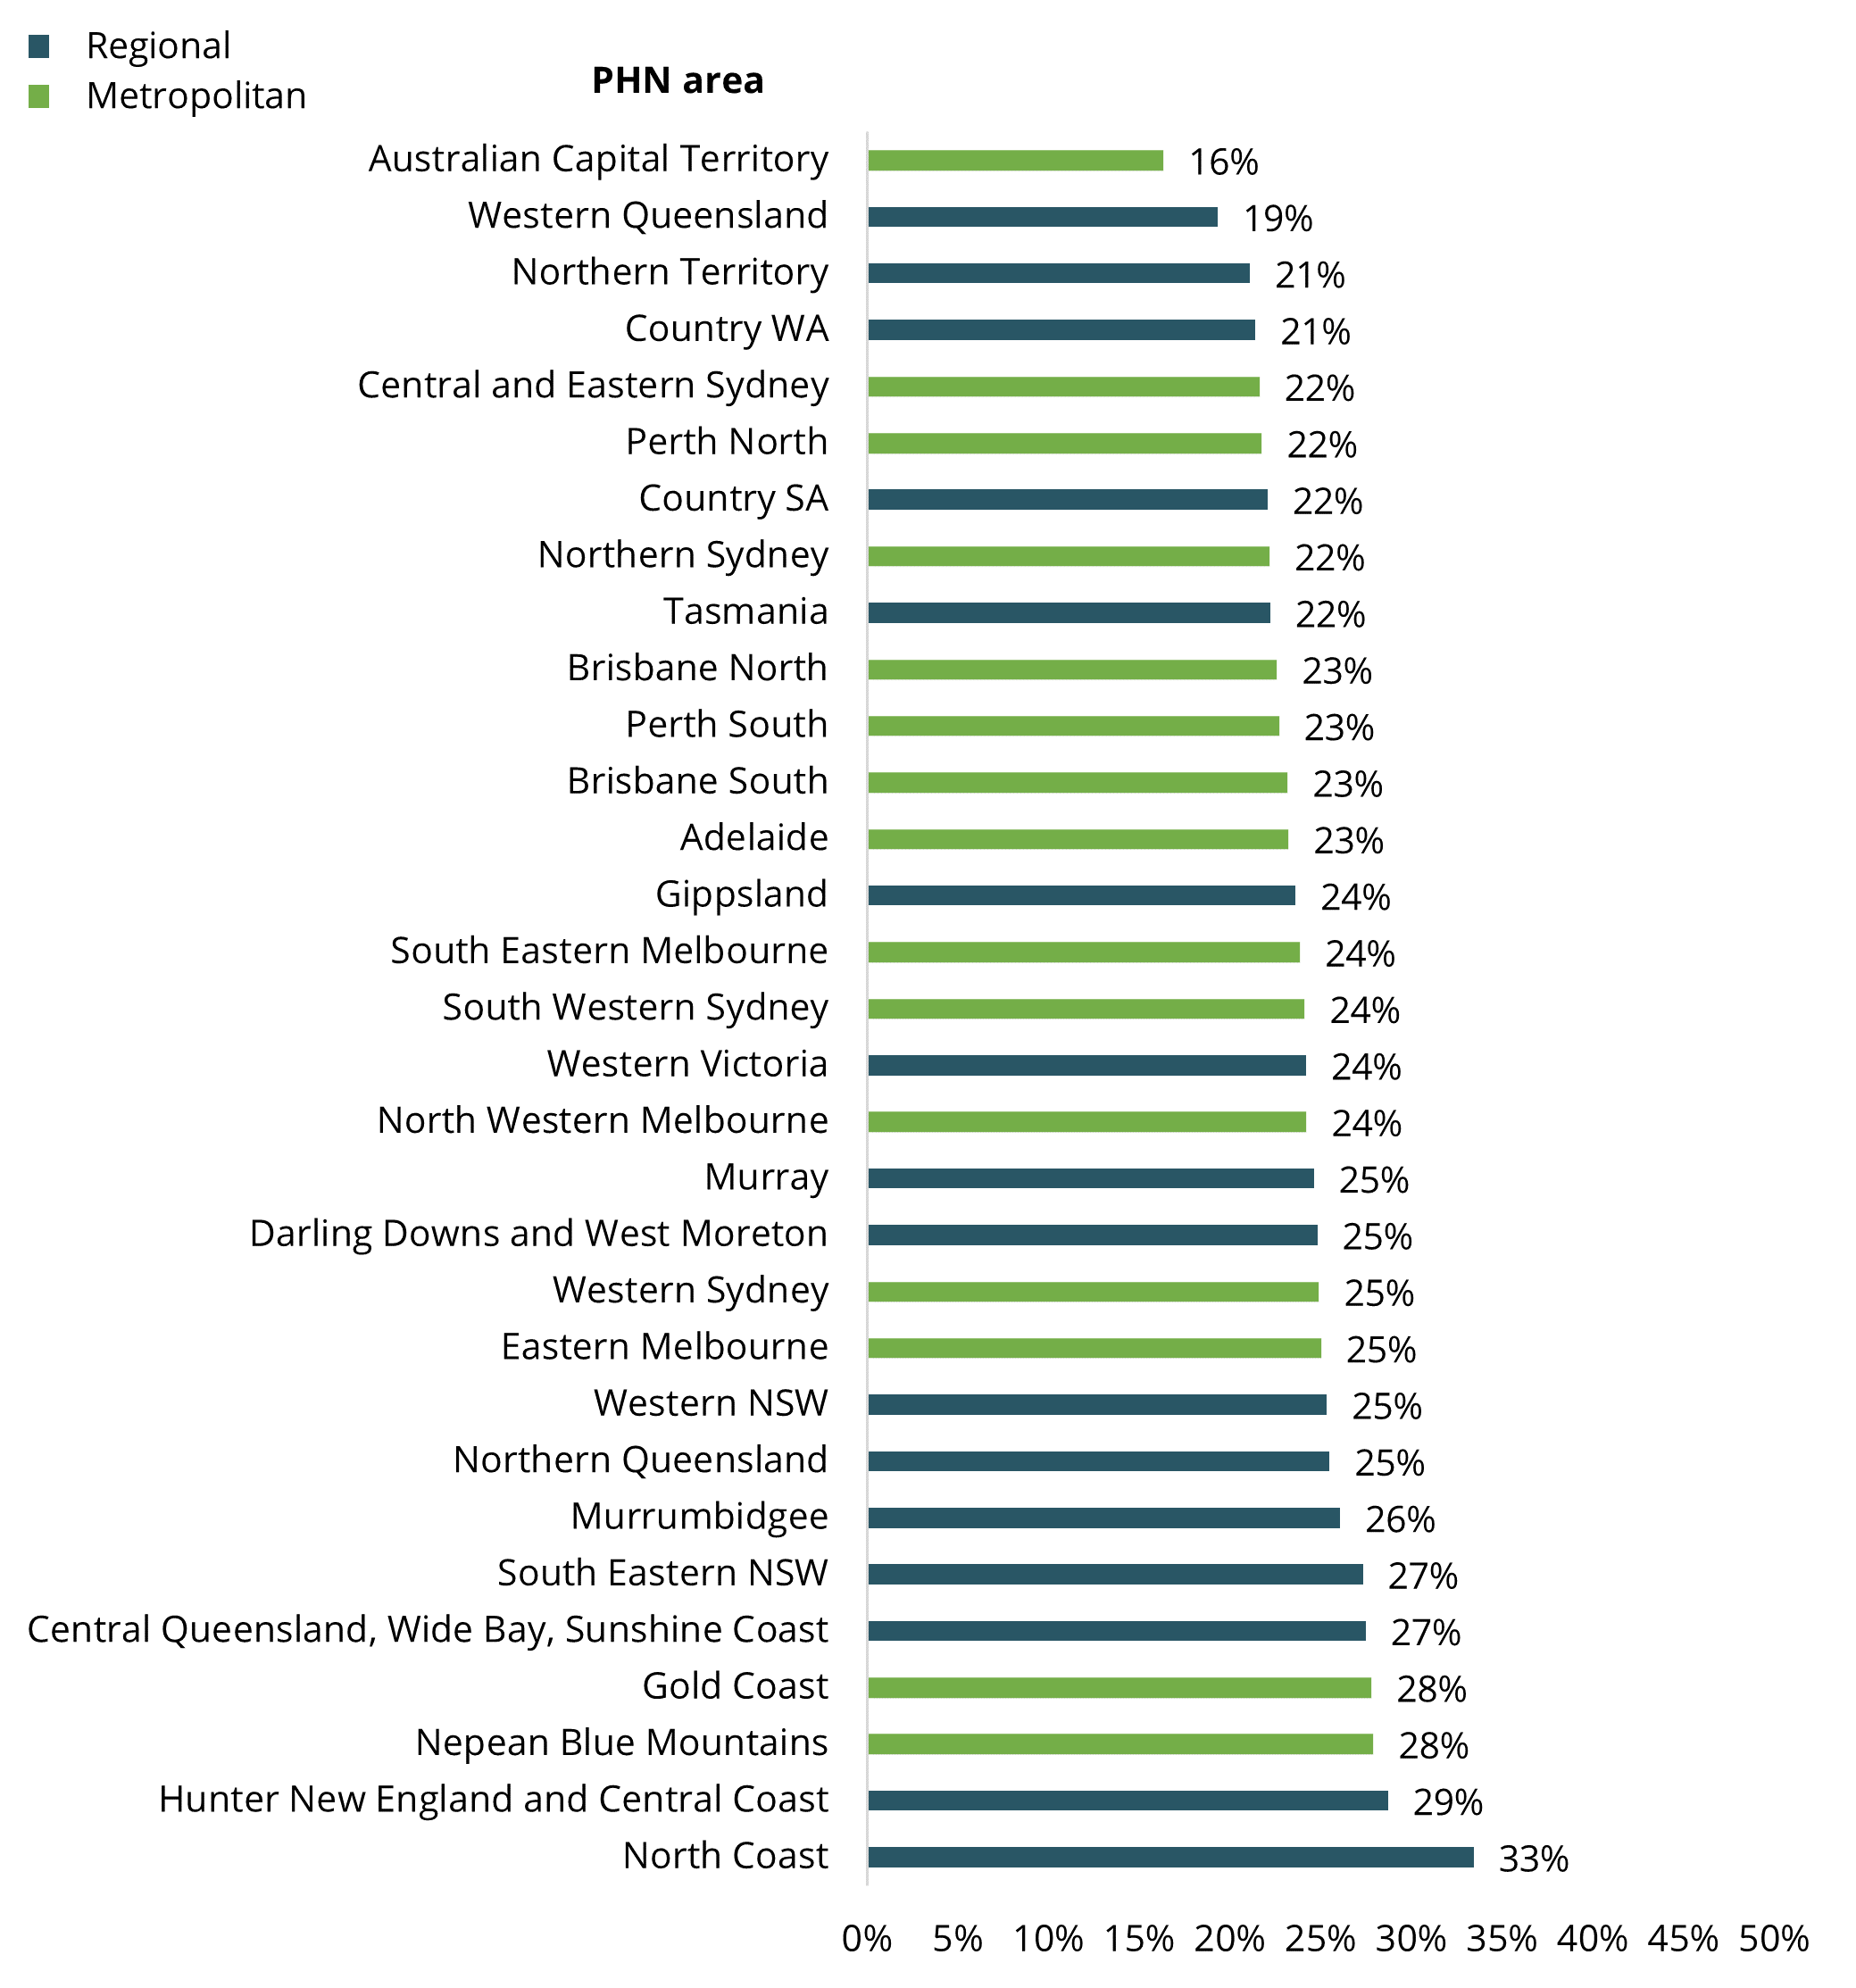
Chart: AIHW. Sources: AIHW analysis of Department of Health and Aged Care, MBS claims data; ABS ERP.