Summary
Emergency departments (EDs) are a vital part of Australia’s health care system; they provide care for people who require urgent, and often life-saving, medical attention. However, many people present to the ED for health conditions that may be managed more appropriately and effectively in a different health care setting, such as through their general practitioner (GP) or a community walk-in clinic. Understanding who uses emergency care services can inform health care planning, coordination and delivery to ensure that people receive the right care, in the right place, at the right time.
The first section of this report explores variation in a cohort of ED presentations referred to as lower urgency care (Box 1). Between 2015−16 and 2018−19, about one-third of ED presentations were classified as lower urgency and close to half of all lower urgency ED presentations were for people aged under 25.
Additional measures to understand the number of ED presentations per hour, arrivals by ambulance, and admissions to hospital by triage category have been included to help inform services and initiatives which aim to reduce the number of ED presentations for lower urgency care.
Box 1: What is lower urgency care?
Lower urgency ED presentations are defined as presentations at formal public hospital EDs where the person:
- had a Type of visit to the ED of Emergency presentation
- was assessed as needing semi-urgent (triage category 4: should be seen within 1 hour) or non-urgent care (category 5: should be seen within 2 hours)
- did not arrive by ambulance, or police or correctional vehicle
- was not admitted to the hospital, was not referred to another hospital, and did not die.
Why measure lower urgency ED presentations?
ED presentations that are lower urgency are sometimes used as a proxy measure of access to primary health care. Higher presentation rates may suggest a lack of access to GPs or other primary health services, which may have been better placed to manage a person’s health condition.
This measure is based on triage categories, which reflects urgency, not the complexity or severity of a person’s health condition, or the most appropriate and cost-efficient model of care for that region. It is important not to assume that all lower urgency ED presentations can be treated in a primary health care setting. For instance, an elderly person living in a small regional town who fractures their arm may be more appropriately treated at an ED rather than their local GP. This person may receive a triage category of 4 or 5 but may have pre-existing health conditions and need diagnostic imaging tests not readily available at the GP. Understanding how and when people use EDs can help to improve decision-making, service planning, and care coordination.
Who visits EDs for lower urgency care?
Around 1 in 3 ED presentations (35%, or 2.9 million) were classified as lower urgency in 2018–19—117.4 presentations per 1,000 people. This rate has remained relatively stable since 2015−16 (118.4 per 1,000 people). The proportion of ED presentations classified as lower urgency has fallen slightly since 2015−16 (38%).
Higher rates among children and young people
Close to half of all lower urgency ED presentations (45% or 1.3 million) were for people aged under 25; children under 15 represented 29% (or 852,000) of all lower urgency ED presentations and had the highest presentation rate (181 per 1,000 people). Conversely, people aged 65 and over accounted for 11% of lower urgency ED presentations (312,000 presentations, at a rate of 80 per 1,000 people) (Figure 1).
Figure 1: Lower urgency ED presentations per 1,000 people, by age group, all-hours, 2018–19
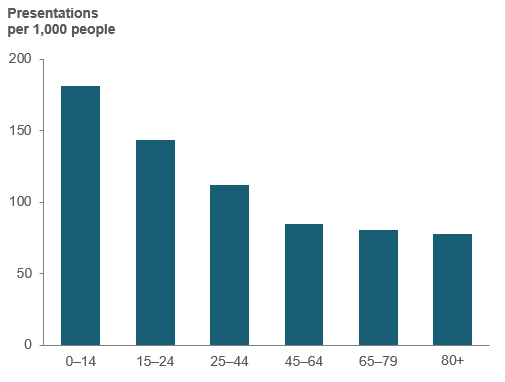
Source: AIHW analysis of the NNAPEDCD, 2018–19.
Half of all lower urgency ED presentations are after-hours
Just under half (47%) of all lower urgency ED presentations occurred during a period when general practices and other alternate health services are usually closed (after-hours, see Box 2 and Figure 2). People aged under 65 were more likely to present to ED after-hours (48% of presentations for this age group) than people aged 65 and over (39% of presentations for this age group). This proportion has slightly decreased for both cohorts since 2015–16—down from 50% and 41%, respectively.
Figure 2: Lower urgency ED presentations per 1,000 people, by presentation time, 2015–16 to 2018–19
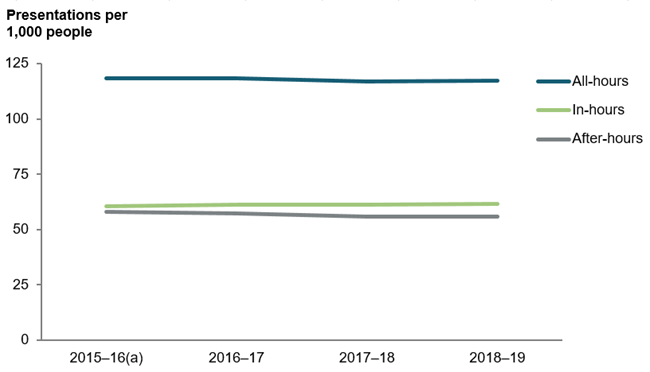
(a) Excludes data for ED presentations that occurred in the ACT in 2015–16, as it was not available at the time of publication.
Source: AIHW analysis of the NNAPEDCD, 2015–16 to 2018–19.
Box 2: When is in-hours and after-hours?
In-hours includes weekdays from 8am to 8pm and Saturdays from 8am to 1pm (excluding public holidays).
After-hours includes Sundays, public holidays, weekdays before 8am and from 8pm, and Saturdays before 8am and after 1pm.
See the Technical note for further details.