Comparing suicide rates 2002 to 2016
There are differences between the population profiles of the three Australian Defence Force (ADF) service status groups and the Australian population (Box 3). Because of these differences, comparisons of numbers of suicides between the ADF service status groups and the Australian population are not straightforward. To assist in making comparisons, this report presents rates of suicides and Standardised Mortality Ratios (SMRs) (comparisons of age-adjusted suicide rates).
Box 3: Differences between the ADF and Australian populations
The age and sex profiles of the ADF service status groups and the Australian population differ. The comparative Australian population is older on average and around 50% male, while the ADF service status groups are younger and around 85% male. These age and sex differences need to be accounted for when examining differences in suicide levels between these populations.
Further, the annual population size for each of the service status groups differs. While the serving and reserve populations are relatively stable over time, the ex-serving population in this study started at zero (0) on 1 January 2001 and increases each year as personnel discharge. Unlike the serving and reserve populations, the ex-serving population is also ageing over time.
Suicide rates and SMRs complement information on the number of suicide deaths by taking into account the size and age structure of the underlying population, to provide information on how often suicide death occurs in that population.
For this study, distinct comparison populations were used for each ADF service status group. Lower and upper ages were defined by ages observed within each ADF service status group.
Data for 2001 are not included in the calculation of rates in this report, as data for the serving and reserve populations were not available before 2002 due to a change in Defence personnel management systems at that time. Analysis of ex-serving personnel was restricted to data from 2002 onwards, in line with reporting for serving and reserve groups.
For information on interpreting these results, including changes to previously published data, see Box 2 and the Notes.
Analysis 2002 to 2016
The age-adjusted rate of suicide over the period 2002 to 2016 was 51% lower for current serving men, 47% lower for men in the reserves and 18% higher for ex-serving men, when compared with all Australian men of the same age.
Due to the small number of suicide deaths among women in the ADF in the period 2002 to 2016 it was not possible to perform any further analysis on this group.
Analysis by period 2007 to 2016
Rate of suicide by service status (men)
Observed rates for the three ADF service status groups are presented in this section. They can be validly compared with each other and over time, and can be compared with rates for the Australian population.
See Age-adjusted suicide rates for age-standardised rates, which account for differences in age structures between populations.
Description: This section reports the observed suicide rates for men in the three ADF service status groups, for 3-year periods from 2007 to 2016. Comparisons are made between rates for men in each of the service status groups and to rates for Australian men in the same age range.
While the proportion of women in the ADF is increasing, the number of women serving in the ADF has historically been low, and for privacy and statistical reasons, suicide rates for ADF women are not reported. For further information on interpreting this measure, see Notes.
Results based on cause of death information that is not final are subject to greater change than those based on final cause of death information. However, estimates for all periods are subject to change as improvements to the underlying data are incorporated.
From 2007–2009 to 2014–2016, the rate of suicide among:
- serving men was between 8 and 13 per 100,000 population
- men in the reserves was between 10 and 15 per 100,000 population
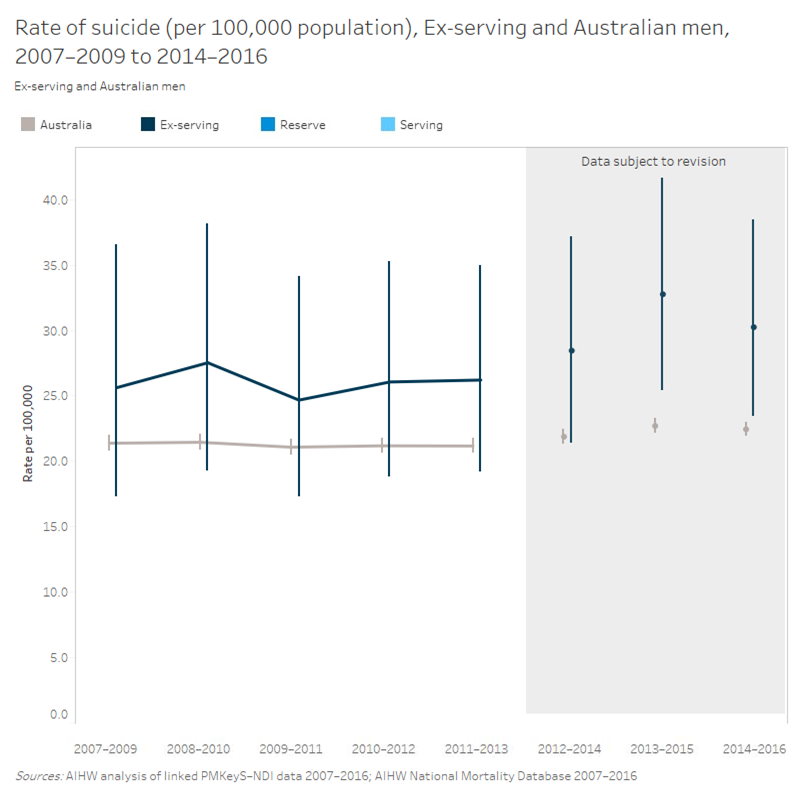
- ex-serving men was between 25 and 33 per 100,000 population.
Suicide rates within each of the three ADF service status groups were largely consistent over the study period. Significance testing using confidence intervals (CIs) supports this finding. See Notes and Data tables for more detail.
Over the study period, the suicide rate among serving men was consistently lower than the rate for Australian men in the same age range. This is supported by the significance testing where, for each time point, the difference was found to be statistically significant.
For men in the reserves, the suicide rate was consistently lower than the rate for Australian men over the study period. This is also supported by the significance testing for the more recent 3-year periods where the difference was found to be significant.
For ex-serving men, the suicide rate was consistently higher than that for men in the Australian population, again supported by the significance testing with the difference found to be significant in recent 3-year periods.
The graph below presents the suicide rate for men in the ex-serving ADF service status group and the rate for the comparative population of Australian men, for all 3-year periods from 2007–2009. The comparison graphs for all other ADF service categories and Australian males are in the Appendix.
Figure 1: Rate of suicide by service status (men)
Data underlying this graph are available in Supplementary tables S1.1 to S1.3. See Data for a link to the tables.
Please note, data are subject to change: see Notes for further detail.
Age-adjusted suicide rates (standardised mortality ratios) by service status (men)
This report uses SMRs to control for the difference in age structures between each of three ADF service status groups and its equivalent comparison (Australian) population.
Description: SMRs are used to compare suicide rates between the three ADF service status groups and the comparison (Australian) population, while controlling for the difference in age structures between these populations (age-adjusted suicide rate).
SMRs for men are presented by service status, for 3-year periods from 2007 to 2016.
Comparisons are made to men in the Australian population. SMRs greater than one indicate age- and sex-specific rates are higher in the ADF population than those in the Australian population; SMRs equal to 1.0 indicate equal rates; and SMRs less than 1.0 indicate lower rates for the ADF population.
SMRs cannot be compared with each other, because different weighting is used to generate each result.
While the proportion of women in the ADF is increasing, the number of women serving in the ADF has historically been low, and for privacy and statistical reasons, suicide rates for ADF women are not reported. For further information on interpreting this measure, see Notes.
Results based on cause of death information that is not final are subject to greater change than those based on final cause of death information. However, estimates for all periods are subject to change as improvements to the underlying data are incorporated.
The age-adjusted suicide rate for ex-serving men was consistently higher than that for men in the Australian population over the study period. A significant difference was observed for the 3-year period 2013–2015 (see Data tables for more detail). When compared with the rate for Australian men, the age-adjusted rate for ex-serving men was between 11% higher (SMR = 1.11) in 2009–2011 and 37% higher (SMR = 1.37) in 2013–2015.
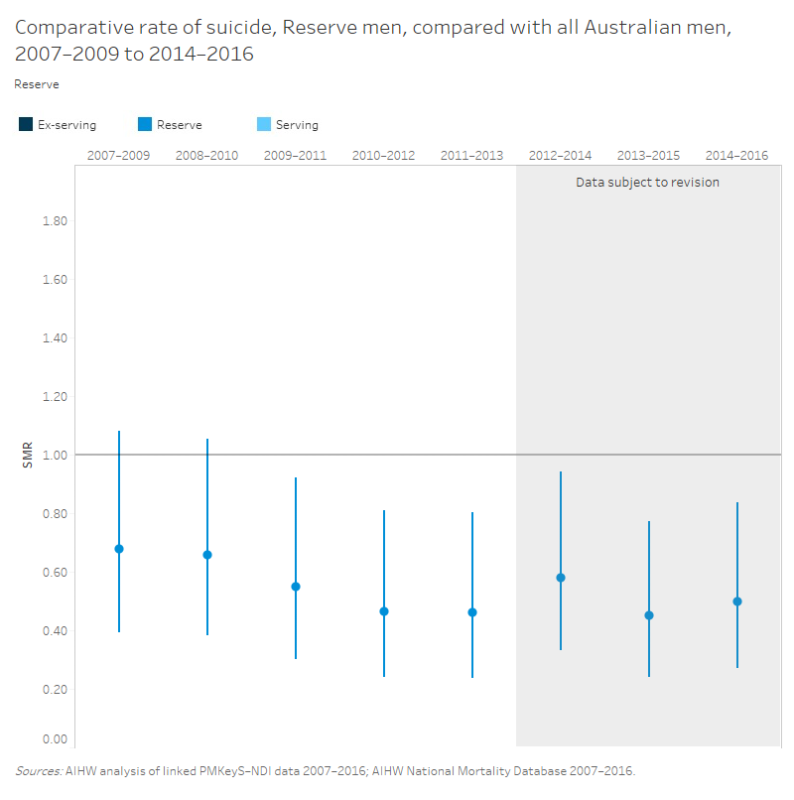
In 2007–2009 to 2014–2016, after adjusting for age, the suicide rate for men in the reserves was consistently lower than that for men in the Australian population. When tested, age-adjusted rates for men in the reserves were found to be significantly lower than rates for Australian men in each 3-year period from 2009–2011 onwards. Over the study period, and when compared with rates for Australian men, the age-adjusted suicide rate for men in the reserves ranged from 32% lower (SMR=0.68) in 2007–2009 to 55% lower (SMR=0.45) in 2013–2015.
After adjusting for age, the suicide rate for serving men was consistently lower when compared with an age-matched population of Australian men in each period between 2007–2009 and 2014–2016. For each 3-year period, the difference was found to be significant when tested. When compared with the rate for Australian men, the age-adjusted rate for serving men was between 63% lower (SMR=0.37) in 2012–2014 and 38% lower (SMR=0.62) in 2009–2011.
The age-adjusted comparisons of suicide rates for men in the reserve service status group and Australian men between 2007–2009 and 2014–2016 are presented in the interactive graph below. The graphs for serving and ex-serving males are in the Appendix.
Figure 2: Age-adjusted suicide rates (standardised mortality ratios) by service status (men)
Data underlying this graph are available in Supplementary tables S2.1 to S2.3. See& Data for a link to the tables.
Please note, data are subject to change: see Notes for further detail.
Suicide rates by age (ex-serving men, aged under 30 and aged 30 years and over)
Description: This section presents suicide rates per 100,000 population for ex-serving men aged under 30 and those aged 30 years and over, for 3-year periods from 2007 to 2016. Comparisons are made to rates for men in the same age range in the Australian population.
While the proportion of women in the ADF is increasing, the number of women serving in the ADF has historically been low, and for privacy and statistical reasons, suicide rates for ADF women are not reported. For further information on interpreting this measure, see Notes.
Results based on cause of death information that is not final are subject to greater change than those based on final cause of death information. However, estimates for all periods are subject to change as improvements to the underlying data are incorporated.
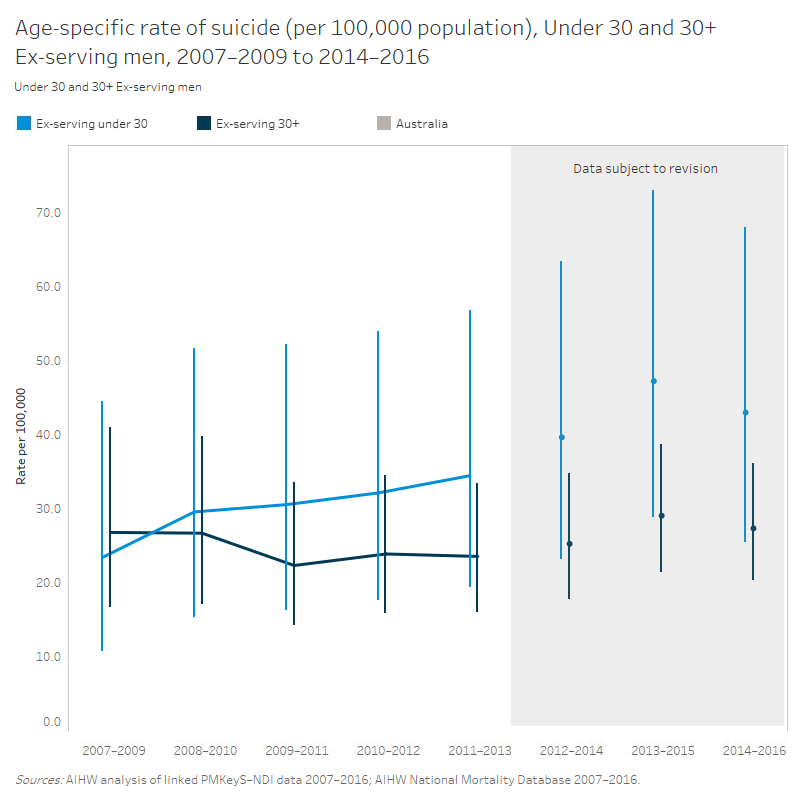
From 2007–2009 to 2014–2016 the suicide rate for ex-serving men aged under 30 was consistently higher than that for men in the same age range in the Australian population. When tested, the difference was significant from 2012–2014 onwards. The suicide rate for ex-serving men aged under 30 was 23 per 100,000 at the start of the study period and 43 per 100,000 at the end. The rate for all Australian men under 30 was steady at 17–19 per 100,000 over the same period.
The suicide rate for ex-serving men aged 30 years and over ranged between 22 and 29 per 100,000 population over the study period. During this time, there was no evidence of a difference in suicide rates between ex-serving men aged 30 and over and men in the same age range in the Australian population.
The suicide rate for ex-serving men under 30 and 30+ years of age is compared in the graph below. Further comparisons between these groups and Australian males are given in the Appendix.
Figure 3: Suicide rates by age (ex-serving men, aged under 30 and aged 30 years and over)
Data underlying this graph are available in Supplementary tables S3.1 and S3.2. See Data for a link to the tables.
Please note, data are subject to change: see Notes for further detail.
If you need help or support, please contact:
- Open Arms – Veterans & Families Counselling 1800 011 046
- ADF All-hours Support Line 1800 628 036
- Operation Life Online
- Lifeline 13 11 14
- Suicide Call Back Service 1300 659 467
- Beyond Blue Support Service 1300 22 4636
For information on support provided by DVA see: