What is the medical practitioner work setting like?
Employment sector
Medical practitioners work a combination of clinical and non-clinical hours. For clinical hours worked, information about employment sector is collected in the Medical Workforce Survey.
Medical practitioners who reported working clinical hours in the public sector worked an average of 33.1 clinical hours per week in the public sector, while those that reported working clinical hours in the private sector worked an average of 31.4 clinical hours per week in the private sector.
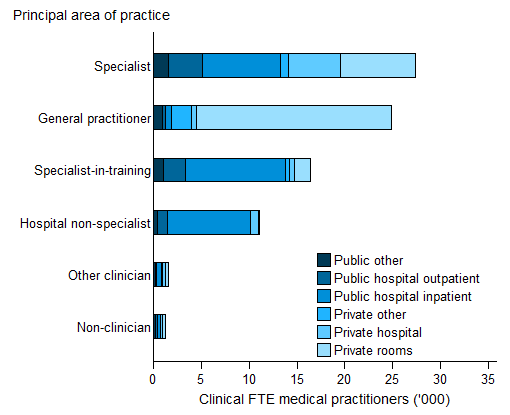
The employment sector of those working clinical hours tended to vary by area of practice (Figure 1):
- General practitioners worked mostly in the private sector (23,211 clinical full-time equivalent (FTE) compared to 1,925 clinical FTE in the public sector, 92.3% vs 7.7% of the total respectively).
- Hospital non-specialists worked mostly in the public sector (10,193 clinical FTE compared to 943 clinical FTE in the private sector, 91.5% vs 8.5% of the total respectively).
- The number of specialists-in-training was also higher in the public sector (13,948 clinical FTE compared to 2,652 clinical FTE in the private sector, 84.0% vs 16.0% of the total respectively).
- Specialists were more evenly spread across the sectors (13,653 clinical FTE in the public sector and 14,334 clinical FTE in the private sector, 48.8% vs 51.2% of the total respectively). This is related to the fact that specialists tend to divide their time between public hospital inpatients (29.9% of their clinical hours), private rooms (28.2%), private hospitals (19.5%) and public hospital outpatient settings (13.2%) (Figure 1).
Figure 1: Total clinical full-time equivalent number for employed medical practitioners who worked clinical hours: employment sector and principal area of practice, 2015
Notes
- Clinician is a medical practitioner who spends the majority of their time working in the area of clinical practice.
- Total clinical FTE is based on total clinical hours worked divided by the standard working week. Standard working week is defined as 40 hours.
Source: NHWDS: medical practitioners 2015.
Employment setting
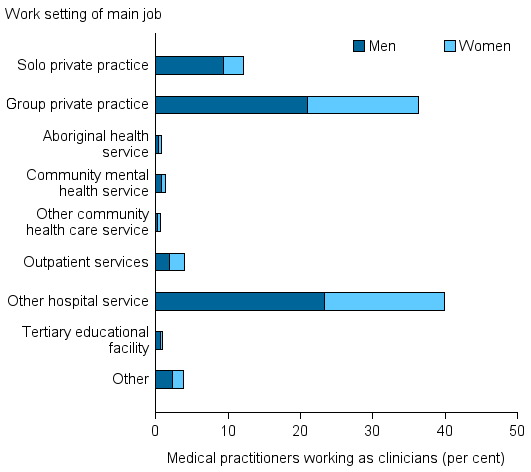
In 2015, the main work setting for the majority of medical practitioners working as clinicians was either in a group or solo private practice (48.4%) or in a hospital (43.9% in a hospital or outpatient service) (Figure 2).
Of those clinicians in group or solo private practices:
- Overall about 3 in 4 (74.9%) were in group practices and 1 in 4 (25.1%) were in solo practices.
- Women were more likely to work in group practices (85.0%) than in solo practices (15.0%) than men (69.0% and 31.0% respectively).
- General practitioners were more likely to work in group practices (87.7%) than in solo practices (12.3%).
- Specialists were more likely to work in solo practices (53.2%), than in group practices (46.8%).
Clinicians working in community healthcare services made up just 2.2% of all employed clinicians.
Hospitals were the largest work setting for non-clinicians with 34.5% of non-clinicians working in hospitals, however non-clinicians made up only 3.9% of medical practitioners working in hospitals. Educational facilities were the work setting of 23.7% of non-clinicians and non-clinicians made up 54.5% of the employed medical practitioners in Educational facilities.
Figure 2: Employed medical practitioners working as clinicians: work setting and sex, 2015
Note: Clinician is a medical practitioner who spends the majority of their time working in the area of clinical practice.
Source: NHWDS: medical practitioners 2015.
Working hours
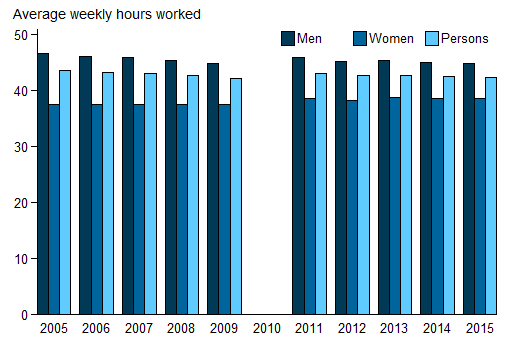
The overall average weekly hours worked by medical practitioners declined slightly from 42.7 in 2012 to 42.4 in 2015. Prior to 2010, hours worked by practitioners showed a decrease between 2005 and 2009, from 43.7 to 42.2 hours per week (Figure 3). There was a slight decrease in the hours worked by men, from 45.3 hours in 2012 to 44.9 in 2015. Women worked 38.6 hours per week on average in 2015, with very little change over time.
Figure 3: Average weekly hours worked by employed medical practitioners, by sex, 2005 to 2015
Notes
- Data prior to 2010 have been presented to show trends for the period before the introduction of the National Registration and Accreditation Scheme. In 2010, due to transitional arrangements, survey data were not available for Western Australia and Queensland. As a result, national data are not available.
- Provisional registration is granted to medical practitioners to enable them to complete a period of supervised practice or internship to be eligible for general registration. This type of registration is intended for practitioners who have completed a Medical Board-approved, accredited qualification in the profession. Data prior to 2010 were based on state/territory-based registration systems and, as a result, treatment of provisional registrants was not consistent across the jurisdictions. Data for 2011 include 2,945 provisional registrants. From 2012, data exclude provisional registrants.
Sources: AIHW Medical Labour Force Survey (2005 to 2009); NHWDS: medical practitioners (2011 to 2015).
Nearly twice the proportion of men (35.0% of men) worked 50 or more hours per week than women (19.6%) in 2015 (Figure 4). The opposite was the case for the proportion working between 20 and 34 hours a week, where the proportions were 25.3% of women compared to 10.5% of men.
Figure 4: Employed medical practitioners: distribution of hours worked per week, by sex, 2015
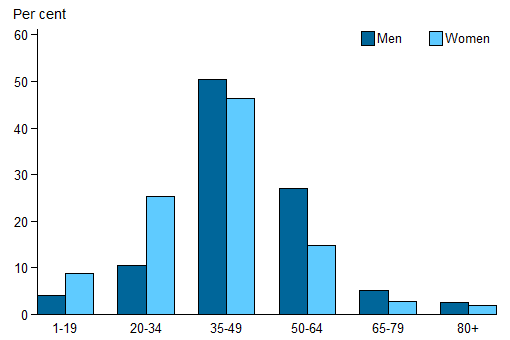
Source: NHWDS: medical practitioners 2015.
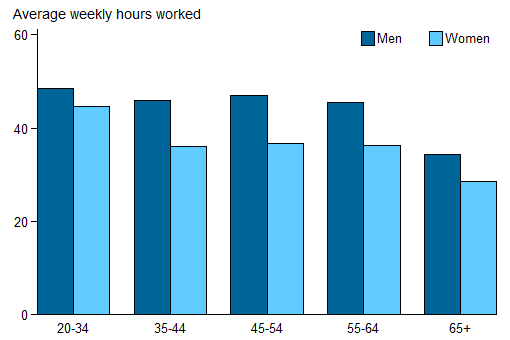
Medical practitioners aged 20–34 worked the highest average weekly hours in 2015 (48.4 and 44.7, for men and women respectively). Men and women aged 65 years or older worked the lowest average weekly hours (34.3 and 28.5, respectively). Men worked more hours per week, on average, than women in every age group, with the greatest difference in hours worked among those aged 45–54 at 10.5 hours a week (Figure 5).
Figure 5: Employed medical practitioners: average weekly hours worked, by age group, 2015
Source: NHWDS: medical practitioners 2015.
Medical practitioners from Major cities, Hobart or Darwin also working in a regional or remote location
Many medical practitioners work in more than one work location so the information presented above on the basis of the primary location alone is just one perspective on workforce supply.
In this section, information is presented on how medical practitioners with jobs in the major service centers of the states and territories also reported working in regional, rural or remote areas, in their own state or territory or another one. The focus is on medical practitioners who reported their main job being in the Major cities remoteness areas and Hobart and Darwin (because in the remoteness area classification they fall into Inner regional and Outer regional areas respectively).
From this we can see that the areas of the Northern Territory other than Darwin have 19.7 full time equivalent medical practitioners per 100,000 population worth of supply from the major centers of Australia. Given that the supply of medical practitioners reporting their main job in the Northern Territory was 499.0 per 100,000 population this is a small but notable contribution.
For general practitioners working in a second location, the Northern Territory had the highest FTE rate per 100,000 population at 3.6, three times the national rate of 1.2. Tasmania and Queensland have the lowest rates at 0.4 and 0.8 respectively.
Specialists had a higher rate of movement between areas, with the national rate for specialists being about four and a half times the rate for general practitioners (5.5 compared to 1.2 respectively); when overall there are only 5% more specialists than general practitioners. By comparison, the FTE number of employed specialists per 100,000 population in Inner regional, Outer regional and Remote/Very remote remoteness areas in 2015 were 82.7, 61.5 and 34.2 respectively. This shows that the movement of specialists has a notable impact on regional supply. The FTE rates for specialists varied along similar lines to the general practitioners with the Northern Territory having the highest rate at 10.4 FTEs per 100,000 population, about twice the national rate of 5.5. Queensland and Tasmania had the lowest rates (2.6 and 2.9 respectively).
| NSW | Vic | Qld | WA | SA | Tas | ACT | NT | Australia | |
|---|---|---|---|---|---|---|---|---|---|
| General practitioner | 1.1 | 1.3 | 0.8 | 2.0 | 2.5 | 0.4 | — | 3.6 | 1.2 |
| Hospital non-specialist | 0.9 | 0.8 | 0.3 | 0.7 | 0.2 | 0.0 | — | 1.2 | 0.6 |
| Specialist | 6.9 | 6.0 | 2.6 | 5.5 | 10.1 | 2.9 | — | 10.4 | 5.5 |
| Other | 1.5 | 0.9 | 0.5 | 0.9 | 1.1 | 0.8 | — | 4.4 | 1.0 |
| Total | 10.4 | 9.0 | 4.2 | 9.2 | 13.9 | 4.1 | — | 19.7 | 8.4 |
Notes
- Main job may be located in Major city remoteness areas, Hobart or Darwin (as defined by ASGS Statistical area level 4).
- The second location excludes Major city remoteness areas, Hobart and Darwin (as defined by ASGS Statistical area level 4).
- Full-time equivalent (FTE) rates are equal to the FTE number per 100,000 population, which is based average days per month worked divided by 21.4 to approximate the number of working days in a month.
- Role of job undertaken at other location may not be the same as the principal role of the main job, e.g. a medical practitioner who is a general practitioner in their main job may work as a hospital non-specialist at a regional clinic.
- Other includes specialist-in-training and other clinician.
- The ACT has only small populations and no health facilities in regional areas.
Source: NHWDS: medical practitioners 2015.