Who are medical practitioners?
Age and sex
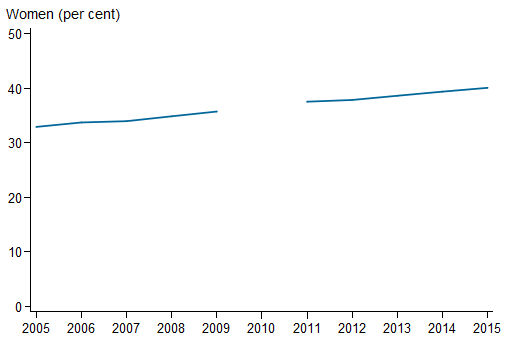
The proportion of women among employed medical practitioners has increased steadily since 2005. In 2015, women made up 40.1% of the medical workforce, up from 37.9% in 2012 and 32.9% in 2005 (Figure 1).
Figure 1: Employed medical practitioners: proportion of women, 2005 to 2015
Notes
- Data prior to 2010 have been presented to show trends for the period before the introduction of the National Registration and Accreditation Scheme. In 2010, due to transitional arrangements, survey data were not available for Western Australia and Queensland. As a result, national data are not available.
- Provisional registration is granted to medical practitioners to enable them to complete a period of supervised practice or internship to be eligible for general registration. This type of registration is intended for practitioners who have completed a Medical Board-approved, accredited qualification in the profession. Data prior to 2010 were based on state/territory-based registration systems and, as a result, treatment of provisional registrants was not consistent across the jurisdictions. Data for 2011 include 2,945 provisional registrants. From 2012, data exclude provisional registrants.
Sources: AIHW Medical Labour Force Survey (2005 to 2009); NHWDS: medical practitioners (2011 to 2015).
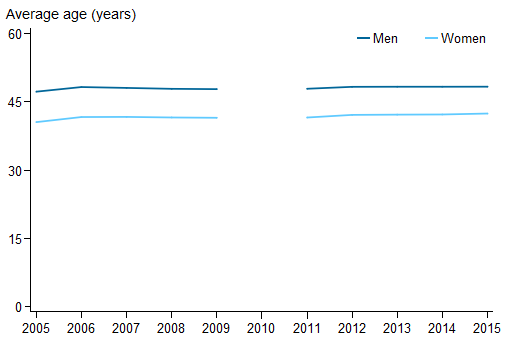
The average age of employed medical practitioners remained close to 48 years for men from 2005 to 2015, and increased slightly for women, from just under 41 in 2005 to just over 42 in 2015. The gap between the average ages of male and female practitioners narrowed over the same period, from 6.7 years in 2005 to 5.9 in 2015 (Figure 2).
Figure 2: Employed medical practitioners: average age, sex, 2005 to 2015
Notes
- Data prior to 2010 have been presented to show trends for the period before the introduction of the National Registration and Accreditation Scheme. In 2010, due to transitional arrangements, survey data were not available for Western Australia and Queensland. As a result, national data are not available.
- Provisional registration is granted to medical practitioners to enable them to complete a period of supervised practice or internship to be eligible for general registration. This type of registration is intended for practitioners who have completed a Medical Board-approved, accredited qualification in the profession. Data prior to 2010 were based on state/territory-based registration systems and, as a result, treatment of provisional registrants was not consistent across the jurisdictions. Data for 2011 include 2,945 provisional registrants. From 2012, data exclude provisional registrants.
Sources: AIHW Medical Labour Force Survey (2005 to 2009); NHWDS: medical practitioners (2011 to 2015).
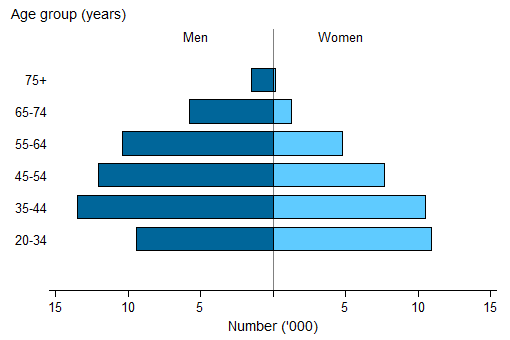
In 2015, over a quarter (27.2%) of employed medical practitioners were aged 55 or older. The age pattern of women and men was different, with substantially more men in the older age groups, peaking at 89.7% for men in the 75 or older age group. There were more women than men in the 20–34 age group (53.4% women) (Figure 3).
Figure 3: Number of employed medical practitioners, by age group and sex, 2015
Source: NHWDS: medical practitioners 2015.
Aboriginal and Torres Strait Islander medical practitioners
The proportion of medical practitioners employed in Australia who identified as Aboriginal or Torres Strait Islander fluctuated in earlier data, possibly due to low response rates. After the introduction of the National Registration and Accreditation Scheme, about 0.3% of all employed medical practitioners chose to identify as Indigenous in 2011 and 2012. There was an increase in the proportion to 0.5% in 2014 and 2015 (Figure 4), which may in part be due to changes in survey questionnaire design.
Figure 4: Employed medical practitioners: proportion who identified as an Aboriginal or Torres Strait Islander, 2006 to 2015
 (0.0 to 0.5) on the y axis; year (2006 to 2015) on x axis.")
Notes
- Data prior to 2010 have been presented to show trends for the period before the introduction of the National Registration and Accreditation Scheme. In 2010, due to transitional arrangements, survey data were not available for Western Australia and Queensland. As a result, national data are not available.
- Provisional registration is granted to medical practitioners to enable them to complete a period of supervised practice or internship to be eligible for general registration. This type of registration is intended for practitioners who have completed a Medical Board-approved, accredited qualification in the profession. Data prior to 2010 were based on state/territory-based registration systems and, as a result, treatment of provisional registrants was not consistent across the jurisdictions. Data for 2011 include provisional registrants. From 2012, data exclude provisional registrants.
- Percentages exclude the 'not stated' category.
Sources: AIHW Medical Labour Force Survey (2006 to 2009); NHWDS: medical practitioners (2011 to 2015).
New South Wales (0.6%) and Queensland (0.6%) had proportions of employed medical practitioners who identified as Aboriginal or Torres Strait Islander above the national proportion of 0.5% (Figure 5). Numbers of Indigenous employed medical practitioners who identified as Aboriginal or Torres Strait Islander in the Northern Territory and the Australian Capital Territory were small, so the proportions should be interpreted with caution.
Figure 5: Employed medical practitioners: Indigenous status, jurisdiction, 2015
Notes
-
Derived from 'state and territory of main job' where available; otherwise, 'state and territory of principal practice' is used as a proxy. If state and territory details are unavailable, 'state and territory of residence' is used. Records with no information on all 3 locations are coded to 'not stated' but are included in Australian totals.
- Data include employed medical practitioners who did not state or adequately describe their state or territory of principal practice and employed medical practitioners who are overseas.
- Percentages exclude the 'not stated' category.
Source: NHWDS: medical practitioners 2015.
The age structure of employed medical practitioners who identified as Indigenous in 2015 was much younger than that for non-Indigenous practitioners, only 16% of Indigenous medical practitioners were aged 55 years or older, compared with 28% of non-Indigenous practitioners. Conversely 30.6% of Indigenous practitioners were aged less than 35 years compared with 22.5% of non-Indigenous practitioners (Figure 6).
Figure 6: Employed medical practitioners: Indigenous status, age group, 2015
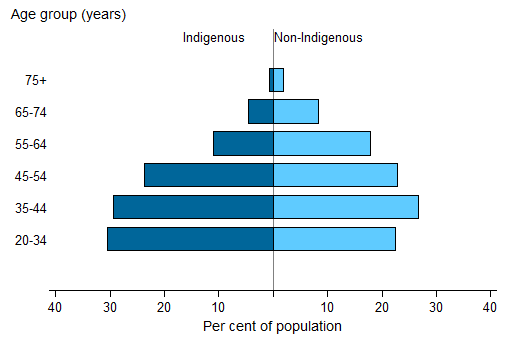
Note: Percentages exclude the 'not stated' category.
Source: NHWDS: medical practitioners 2015.
Country of initial medical qualification
In 2015, two-thirds (56,983 or 66.6%) of employed medical practitioners who answered the question about country of initial medical qualification (97% of the total) gained their initial medical qualification in Australia (Figure 7). The proportion of employed medical practitioners who gained their qualification in Australia remained stable from 2012 to 2015.
Figure 7: Employed medical practitioners: country of first medical qualification, 2012 to 2015
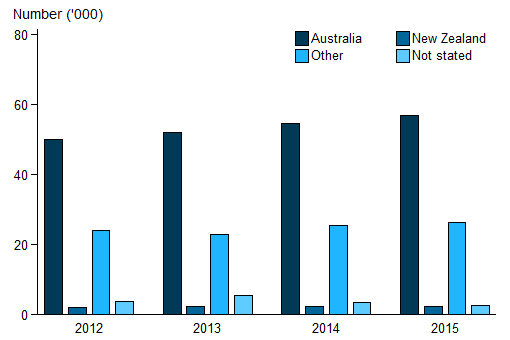
Source: NHWDS: medical practitioners (2012 to 2015).
Among practitioners whose initial qualification was obtained overseas, those who qualified in India were the largest group (4,771 or 5.6%), followed by England (4,005 or 4.7%) and New Zealand (2,155 or 2.5%) (Table 1).
| Country of initial medical qualification | Number | Per cent |
|---|---|---|
| Australia | 56,983 | 66.6 |
| India | 4,771 | 5.6 |
| England | 4,005 | 4.7 |
| New Zealand | 2,155 | 2.5 |
| Other Europe | 1,865 | 2.2 |
| South Africa | 1,848 | 2.2 |
| Middle East | 1,581 | 1.8 |
| Other Asia | 1,537 | 1.8 |
| Sri Lanka | 1,432 | 1.7 |
| Ireland | 1,063 | 1.2 |
| Scotland | 1,019 | 1.2 |
| China | 614 | 0.7 |
| Philippines | 541 | 0.6 |
| Other Africa | 439 | 0.5 |
| Malaysia | 267 | 0.3 |
| South America | 267 | 0.3 |
| Zimbabwe | 182 | 0.2 |
| United States of America | 176 | 0.2 |
| Oceania | 116 | 0.1 |
| Canada | 109 | 0.1 |
| Other(a) | 4,581 | 5.4 |
| Not stated/Not applicable | 2,489 | . . |
| Total | 88,040 | 100 |
- Other may include some Other Europe, Other Asia and Other Africa due to survey respondents selecting Other rather than the appropriate continent when their country of initial medical qualification is not an available response.
Source: NHWDS: medical practitioners 2015.
A higher proportion of medical practitioners qualified in Australia were women (41.0%) compared to overseas-qualified practitioners (38.0%).
Country of initial specialist medical qualification
In 2015, about 4 in 5 (80.9%) medical specialists who answered the question about country of initial specialist qualification (98% of the total) gained their initial medical specialist qualification in Australia. Among specialists with their initial specialist qualification obtained overseas, England was the largest group (1,819 or 6.0%), followed by India (884 or 2.9%) and New Zealand (723 or 2.4%).