How many nurses and midwives are there?
In Australia, nurses and midwives can register as a registered nurse, enrolled nurse, midwife, or some combination of these. Nurses and midwives need to be registered to be employed in Australia, however not all those who are registered are employed.
In 2015, the total number of nurses and midwives registered in Australia was 360,008. Of these, 263,209 were registered as a registered nurse only, 59,429 were registered as an enrolled nurse only and 3,591 were registered as a midwife only.
| Registration category | Number | Average age | Men (per cent) |
|---|---|---|---|
| Registered nurse only | 263,209 | 43.4 | 11.8 |
| Enrolled nurse only | 59,429 | 45.9 | 9.4 |
| Midwife only | 3,591 | 38.5 | 0.4 |
| Registered and enrolled nurse | 4,719 | 37.6 | 14.4 |
| Registered nurse and midwife | 28,954 | 50.1 | 1.8 |
| Enrolled nurse and midwife | 55 | 36.7 | 1.8 |
| Registered and enrolled nurse and midwife | 51 | 35.6 | 2.0 |
| Total nurse registrations | 356,417 | 44.3 | 10.6 |
| Total midwife registrations | 32,651 | 48.8 | 1.6 |
| Total registrations | 389,068 | 44.7 | 9.9 |
| Total people registered | 360,008 | 44.2 | 10.5 |
Source: AIHW NHWDS.
The total number of all nurses and midwives registered in Australia increased from 330,680 in 2011 to 360,008 in 2015 (8.9%). While the number of registered nurses increased, there was a large decrease in registered midwives of 21.2% between 2011 and 2015. This is related to the introduction of new 'recency of practice' standards that mean midwives must be actively working in midwifery to maintain their registration.
The number of registered nurses increased by 11.0% between 2011 and 2015, while the number of enrolled nurses decreased by 0.8%.
| Nursing and midwifery category | 2011 | 2012(a) | 2013(a) | 2014(a) | 2015(a) | Change 2011 to 2015 (per cent) |
|---|---|---|---|---|---|---|
| Registered nurses | 270,746 | 275,678 | 285,698 | 293,678 | 300,524 | 11.0 |
| Registered midwives | 41,432 | 35,632 | 33,969 | 33,114 | 32,651 | –21.2 |
| Enrolled nurses | 59,934 | 58,400 | 58,492 | 59,160 | 59,484 | –0.8 |
| Total nurses and midwives | 330,680 | 334,078 | 334,190 | 352,838 | 360,008 | 8.9 |
- Data for registered nurses also include people with dual registrations and those who were registered as a ‘midwife only’.
Sources: AIHW NHWDS.
In 2015, 92.0% of all registered nurses and midwives were in the nursing and midwifery workforce (331,015). Of these, 8,930 were looking for work in nursing and midwifery, compared to around the same number as in 2014 (9,110).
Figure 1: Registered nurses and midwives: workforce status, 2015
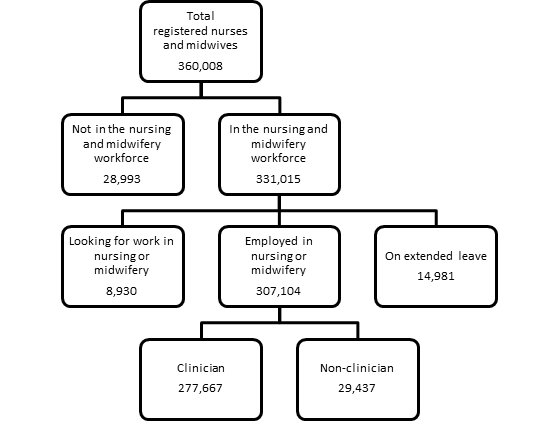
Note: A clinician is a person who spends the majority of his or her time working in the area of clinical practice.
Source: AIHW NHWDS.
Supply of employed nurses and midwives
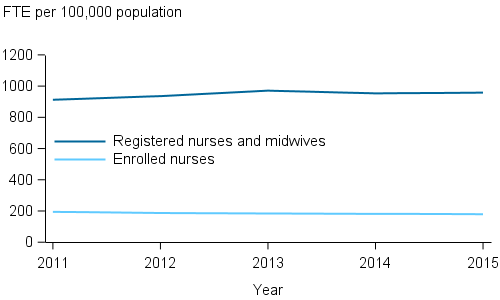
In 2015, the overall supply of employed nurses and midwives was 1,138 FTE per 100,000 population, up from 1,107 in 2011 and around the same as in 2014 (1,135).
Between 2011 and 2015, the supply of registered (Division 1) nurses and midwives increased (912 to 958 FTE per 100,000 population). The supply of enrolled (Division 2) nurses decreased (195 to 179 FTE per 100,000 population).
Figure 2: Employed nurses and midwives: FTE rate, 2011 to 2015
Notes
- In 2012, the survey design changed so that the hours reported were split by nursing and midwifery.
- From 2011 to 2015, data for registered nurses include people with dual registrations and those who were registered as a 'midwife only'.
- In 2010, due to the transition to the NRAS, no workforce survey was conducted.
- Full-time equivalent (FTE) per 100,000 population. FTE is based on total weekly hours worked.
Sources: AIHW NHWDS.
States and territories
In 2015, the overall supply of employed nurses and midwives varied across the states and territories, from 1,036 FTE per 100,000 population in New South Wales to a high of 1,534 in the Northern Territory. Comparatively, supply in 2011 ranged from 993 FTE nurses and midwives per 100,000 population in New South Wales to 1,504 in the Northern Territory.
| NSW | Vic | Qld | WA | SA | Tas | ACT | NT | Australia | |
|---|---|---|---|---|---|---|---|---|---|
| 2011 | 993 | 1,182 | 1,091 | 1,037 | 1,388 | 1,239 | 1,164 | 1,504 | 1,107 |
| 2012 | 1,013 | 1,188 | 1,107 | 1,062 | 1,416 | 1,179 | 1,182 | 1,610 | 1,123 |
| 2013 | 1,062 | 1,211 | 1,122 | 1,094 | 1,443 | 1,257 | 1,213 | 1,633 | 1,155 |
| 2014 | 1,045 | 1,189 | 1,112 | 1,067 | 1,401 | 1,239 | 1,208 | 1,618 | 1,135 |
| 2015 | 1,036 | 1,191 | 1,144 | 1,070 | 1,386 | 1,261 | 1,193 | 1,534 | 1,138 |
Notes
- In 2012 the survey design changed so that the hours reported were split by nursing and midwifery. This coincides with an increase in the FTE rate in 2012, 2013 and 2014. Care should be taken when comparing the FTE data across years.
- Derived from 'state and territory of main job' where available; otherwise, 'state and territory of principal practice' is used as a proxy. If principal practice details unavailable, 'state and territory of residence' is used. Records with no information on all three locations are coded to 'not stated'.
- Full-time equivalent (FTE) per 100,000 population. FTE is based on total weekly hours worked.
Sources: AIHW NHWDS.
Remoteness areas
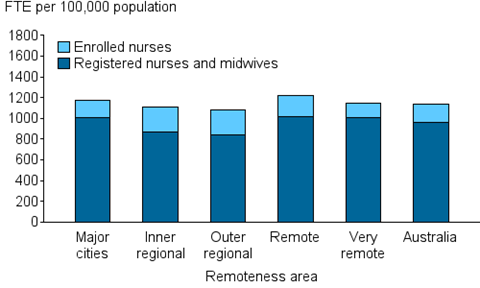
In 2015, the overall supply of employed nurses and midwives varied across remoteness areas, from 1,083 FTE per 100,000 population in Outer regional areas to over 1,219 FTE per 100,000 population in Remote areas. While the average proportion of enrolled nurses in Australia was 15.8 per cent, it was above 20 per cent in both Inner and Outer regional areas. The proportion of enrolled nurses was lowest in Very remote areas where it was 12.1 per cent.
Figure 3: Employed nurses and midwives: FTE rate, remoteness area, 2015
Notes
- In 2012 the survey design changed so that the hours reported were split by nursing and midwifery. This coincides with an increase in the FTE rate in 2012, 2013 and 2014. Care should be taken when comparing the FTE data across years.
- Derived from 'remoteness area of main job' where available; otherwise, 'remoteness area of principal practice' is used as a proxy. If remoteness area details are unavailable, 'remoteness area of residence' is used. Records with no information on all three locations are coded to 'not stated'.
- Very remote areas includes Migratory areas.
- Full-time equivalent (FTE) per 100,000 population. FTE is based on total weekly hours worked.
Source: AIHW NHWDS.