Who are nurses and midwives?
Age and sex
Nurses and midwives are more likely to be women, with women making up 89.3% of all employed nurses and midwives in 2015, around the same as in 2014 (89.4%).
The average age of employed nurses and midwives in both 2011 and 2015 was 44.4 years. The proportion aged 50 and over grew from 38.3% to 39.0%, although this was less than in 2014 (39.4%).
| Nursing and midwifery category | Number | Men (per cent) |
Average age (years) |
Aged 50 and over (per cent) |
|---|---|---|---|---|
| 2011 | ||||
| Registered nurses(b) | 234,052 | 10.2 | 44.2 | 37.2 |
| Registered midwives(c) | 36,827 | 1.9 | 50.1 | 59.1 |
| Enrolled nurses | 52,654 | 9.0 | 45.5 | 43.3 |
| Total nurses and midwives | 286,706 | 10.0 | 44.4 | 38.3 |
| 2015 | ||||
| Registered nurses(b) | 256,034 | 10.9 | 44.1 | 37.3 |
| Registered midwives(c) | 28,211 | 1.6 | 48.8 | 55.6 |
| Enrolled nurses | 51,070 | 9.4 | 46.3 | 47.7 |
| Total nurses and midwives | 307,104 | 10.7 | 44.4 | 39.0 |
- Employed is defined as working any hours in either nursing or midwifery in the week before the survey.
- Data for registered nurses include people with dual registrations and those who were registered as a ‘midwife only’.
- Employed registered midwives who worked any hours as either a midwife or a nurse.
Sources: AIHW NHWDS.
Between 2011 and 2015, increases occurred in the number of employed nurses and midwives in both the 25 to 34 age group (51,686 to 65,099) and the 55 and over group (63,170 to 77,608). Between 2011 and 2015, there were more employed nurses and midwives in the 50–54 year age group than any other age group.
Figure 1: Employed nurses and midwives: age group, 2011 to 2015
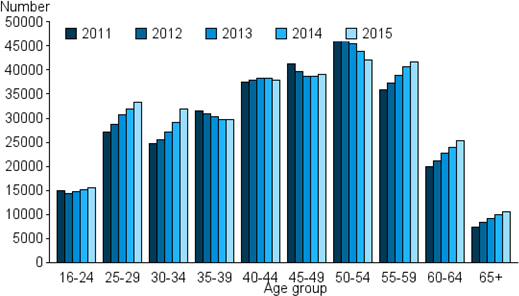
Source: AIHW NHWDS.
Aboriginal and Torres Strait Islander nurses and midwives
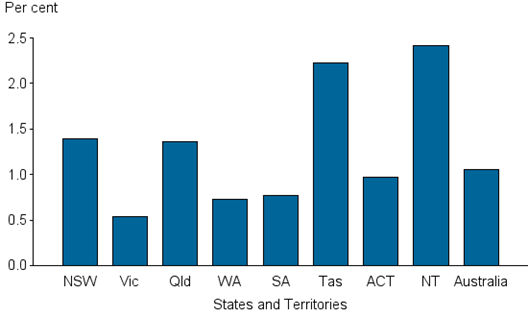
In 2015, there were 3,187 nurses and midwives employed in Australia who identified as an Aboriginal or Torres Strait Islander. This represents 1.1% of all employed nurses and midwives who provided their Indigenous status. The Northern Territory (2.4%) and Tasmania (2.2%) had the highest proportion of nurses and midwives who identified as Aboriginal or Torres Strait Islander, while Victoria had the lowest (0.5%).
Figure 2: Employed nurses and midwives: Indigenous proportion, states and territories, 2015
Note:
Derived from ‘state and territory of main job’ where available; otherwise, ‘state and territory of principal practice’ is used as a proxy. If principal practice details were unavailable, ‘state and territory of residence’ is used. Records with no information on all three locations are coded to ‘not stated’.
Source: AIHW NHWDS.
Country of first nursing and midwifery qualification
Of all employed nurses and midwives, 79.6% (244,421) received their initial nursing and midwifery qualification in Australia, followed by England (14,421 or (4.7%) and India (8,703 or 2.8%).Those employed nurses and midwives who received their initial qualification in Malaysia reported the highest average age (55.7 years) and the highest proportion aged 50 and over (74.5%), while those with initial qualifications from India reported the lowest average age (36.5 years) and the lowest proportion aged 50 and over (5.8%).
Role in nursing and midwifery
In 2015, 90% of employed nurses and midwives in Australia were working as clinicians (277,667). Of those in non-clinical roles, ‘administrator’ was the largest group (14,797), followed by ‘teacher/educator’ (9,847). Administrators reported working the highest average weekly hours (38.5).
| Principal role | Number | Enrolled (per cent) |
Average age (years) |
Aged 50 and over (per cent) | Average weekly hours |
|---|---|---|---|---|---|
| Clinician(b) | 277,667 | 17.6 | 43.9 | 37.5 | 33.2 |
| Administrator | 14,797 | 7.8 | 50.2 | 57.4 | 38.5 |
| Teacher/educator | 9,847 | 5.7 | 47.9 | 46.4 | 34.5 |
| Researcher | 2,700 | 4.9 | 47.9 | 49.3 | 33.6 |
| Other | 2,093 | 21.8 | 49.7 | 56.9 | 32.6 |
| Total | 307,104 | 16.6 | 44.4 | 39.0 | 33.5 |
- Employed is defined as working any hours in either nursing or midwifery in the week before the survey.
- A clinician is a person who spends the majority of his or her time working in the area of clinical practice.
Source: AIHW NHWDS.