Hospitals
Waiting times overview
How long people wait to be seen in emergency departments (EDs) is a measure of the accessibility of ED care.
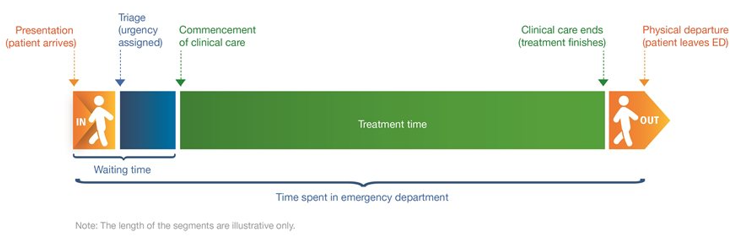
Progress of the patient through the ED is recorded using 5 different time points (Figure 1):
- Presentation time – the time of first recorded contact with an ED staff member, which may be at the start of clerical registration or of the triage process
- Triage time – the time at which the patient was assigned a triage category, which can coincide with presentation time
- Clinical care commencement – the time at which care by a doctor, nurse, mental health practitioner or other health professional commenced, which can also coincide with presentation time
- Episode end time – the time at which the non-admitted patient ED service episode ended
- Physical departure time – the time at which the patient departed the ED, which can coincide with episode end time.
These time points are used to derive the patient’s waiting time, the duration of clinical care, and the length of the emergency department stay.
Figure 1: Time spent in emergency department
Emergency department waiting time is the time elapsed for each patient from presentation to the ED to commencement of clinical care. A patient is considered to have been ‘seen on time’ when the time between arrival at the ED and the time that their clinical care starts is within the time specified in the definition of the triage category that they are assigned:
- Resuscitation: Immediate (within seconds)
- Emergency: within 10 minutes
- Urgent: within 30 minutes
- Semi-urgent: within 60 minutes
- Non-urgent: within 120 minutes.
Explore the data
Explore the emergency department waiting time statistics by triage category in 2024–25 and for recent years in the data visualisation below.
Waiting time statistics for Emergency presentations by triage category, including proportion seen on time, 50th and 90th percentile waiting times