
How do we use health care?
Australia has extensive health prevention and promotion strategies to help us stay as healthy as possible for as long as possible. However, in times of ill health, people need to have access to timely, appropriate and quality health care. This can be provided by a range of health practitioners in the community or in hospital.
Who pays for health services?
Spending on health has grown by about 50% in real terms over the past decade, from $113 billion ($5,500 per person) in 2006–07 to $170 billion ($7,100 per person) in 2015–16. This compares with population growth of about 17% over the same period.
$7,100 per person was spent on health in 2015–16
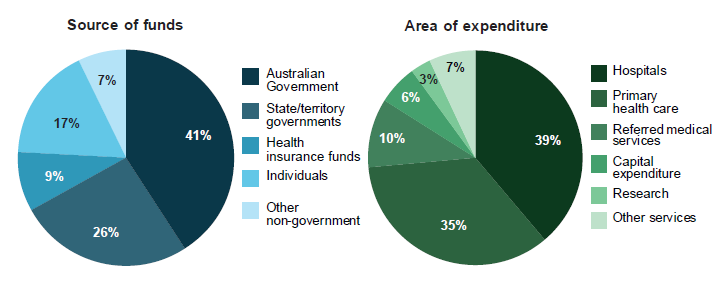
Governments fund two-thirds (67%, or $115 billion) of all health spending, and non-government sources fund the rest (33%, or $56 billion). Individuals contribute more than half (17%, or $29 billion) of the non-government funding.
Together, hospitals (39%) and primary health care (35%) account for three-quarters of all health spending.
Who funds health services and where does the money go?
Find out more: Chapter 2.2 ‘How much does Australia spend on health care?’ in Australia’s health 2018.
Health promotion and prevention
Health promotion and prevention strategies can help to build social and physical environments that support healthy behaviours.
93% of 1 year olds and 5 year olds were fully immunised in 2016
Campaigns to cut the number of road deaths and tobacco smoking rates are among Australia’s most successful health promotion strategies. Road deaths have fallen from 30 to 5.4 per 100,000 people between 1970 and 2016, and daily tobacco smoking rates for people aged 14 and over have halved since 1991, falling from 24.3% to 12.2% in 2016.
Schools also play an active role in promoting healthy behaviours. School policies can be used to regulate the food available for purchase at canteens and programs can be implemented to encourage students to take part in physical activity.
Immunisation and population-based cancer screening programs are major areas of health prevention in Australia. Routine immunisation begins at birth, and incorporates vaccines against 17 diseases, including measles, mumps, and whooping cough. The national program has achieved an immunisation rate of more than 90% for all children at the ages of 1, 2 and 5. Participation in Australia’s three national cancer screening programs ranges from 41% of the target population for bowel cancer screening to 55% for breast cancer screening and 55% for cervical cancer screening.
Find out more: Chapter 4.10 ‘Overweight and obesity’, 7.1 ‘Health promotion’, 7.2 ‘Immunisation and vaccination’ and 7.4 ‘Cancer screening’ in Australia’s health 2018.
Primary health care—our first point of contact with the health system
Primary health care is typically the first point of contact people have with the health system. It is often delivered by a GP but other health professionals such as allied health workers, community health workers, nurse practitioners, pharmacists, dentists, Aboriginal health practitioners and midwives also deliver primary care.
In 2014–15, 85% of Australians had seen a GP and 47% had seen a dentist in the previous 12 months
On average, people are receiving more primary health services than they were 10 years ago.
| Total number of services (million) | Average number of services per person | Change over 10 years | |
|---|---|---|---|
| GP | 148 | 6 |  18% 18% |
| Allied health | 71 | 3 | 43% |
| Dental | 46 | 2 |  No trend data No trend data |
Cost can prevent people accessing health services. In 2016–17, among people aged 15 and over, cost was stated as a reason why:
- 4.1% (663,000) of people who needed to see a GP did not see or delayed seeing a GP at least once
- 18% (2 million) of people who needed to see a dentist did not see or delayed seeing a dental professional at least once
- 7.3% (974,000) of people who needed a prescription medication avoided or delayed filling it.”
Find out more: Chapter 7.5 ‘Primary health care’ in Australia’s health 2018.
How much do we spend on medicines?
Medicines help prevent, treat and cure illnesses. Some are only available by prescription from a health professional; others can be bought over the counter at places such as pharmacies and supermarkets.
In 2015–16, $20.8 billion was spent on medicines, including prescriptions and over-the-counter medicines
The Australian Government helps people pay for nearly 300 million prescription medicines each year under the PBS and Repatriation Pharmaceutical Benefit Scheme (RPBS). Nearly 1 in 3 (88.4 million) PBS prescriptions were for cardiovascular diseases.
In 2015–16, close to $11 billion was spent on these benefit-paid pharmaceuticals. The Australian Government paid for most (87%) of the cost of benefit-paid pharmaceuticals, and individual consumers contributed the remaining 13%.
However, individuals also spend money on medicines that don’t attract a government subsidy, including private prescriptions and over-the-counter medicines. In 2015–16, more than $10 billion was spent on these medicines with individual consumers paying for most of it (93%).
Additionally, hospitals are a major source of spending on medicines: in 2015–16, public hospitals spent nearly $3 billion on medicines not covered by the PBS/RPBS.
| Drug name | Number of PBS medicines dispensed | Common use | |
|---|---|---|---|
| 1 | Atorvastatin | 10.1 million | cholesterol |
| 2 | Rosuvastatin | 10.0 million | cholesterol |
| 3 | Esomeprazole | 9.0 million | gastric reflux |
| 4 | Pantoprazole | 6.5 million | gastric reflux |
| 5 | Perindopril | 6.0 million | blood pressure |
Find out more: Chapter 2.2 ‘How much does Australia spend on health care?’ and 7.6 ‘Medicines in the health system’ in Australia’s health 2018.
What if we need to go to hospital?
Australia has more than 1,300 public and private hospitals; together, they provide about 30 million days of admitted patient care each year, including both same-day and overnight admissions.
The median waiting time for elective surgery in a public hospital was 38 days in 2016–17
Every day, about 21,400 patients use public hospital emergency departments, with an over-representation of people aged 65 and over, children under 5 and Indigenous Australians. Nearly 1 in 3 (31%) emergency department patients are subsequently admitted to hospital.
About two-thirds (67%) of elective surgery (surgery that is planned and can be booked in advance) is performed in private hospitals.
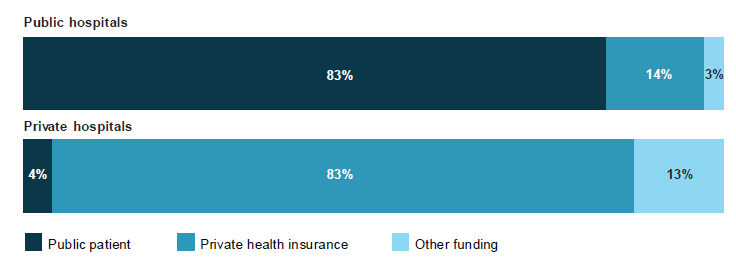
In 2015–16, 42%, or 4.5 million of the 10.6 million admissions in public and private hospitals were at least partially paid for by private health insurance. Private health insurance was used for 14% of admissions in public hospitals and 83% of admissions in private hospitals.
How hospitalisations were funded in 2015–16
Find out more: Chapter 7.7 ‘Overview of hospitals’, 7.8 ‘Funding sources for the care of admitted patients’, 7.10 ‘Emergency department care’ and 7.11 ‘Elective surgery’ in Australia’s health 2018.
Specialised treatment services
The Australian health system provides specialised treatment services to help people with a range of health concerns, including mental illness and alcohol and drug use.
$9 billion was spent on mental health-related services in 2015–16
In 2016–17, GPs provided about one-third (31%) of the 11.1 million mental health-related services that were subsidised by Medicare. In 2015–16, state and territory community mental health care services provided 9.4 million contacts.
More demand for treatment for amphetamine use
Alcohol is the most common principal drug of concern for people seeking help at alcohol and drug treatment services—32% of treatment episodes in 2016–17 were for alcohol—followed by amphetamines (26%). The fastest growing treatment area is for amphetamine use, with the number of episodes more than doubling in the last 5 years.
Suicide prevention activities
Suicide is a significant public health problem in Australia and internationally. Between 2007 and 2016, the age-adjusted suicide rate for males rose from 16 to 18 per 100,000 population, and from 5 to 6 per 100,000 population for females. The age-adjusted suicide rate for Indigenous people is twice the rate for non-Indigenous Australians (24 per 100,000 population compared with 12 per 100,000).
In 2015–16, the Australian Government spent $49.1 million on suicide prevention activities. State and territory governments also fund initiatives under their own suicide prevention strategies, however, the size of this spending is not publicly reported in a consolidated way by all jurisdictions.
If you or someone you know needs help please call:
Lifeline 13 11 14
beyondblue 1300 22 4636
Kids Helpline 1800 55 1800
Find out more: Chapter 7.3 ‘Suicide prevention activities’, 7.19 ‘Specialised alcohol and other drug treatment services’ and 7.20 ‘Mental health services’ in Australia’s health 2018.
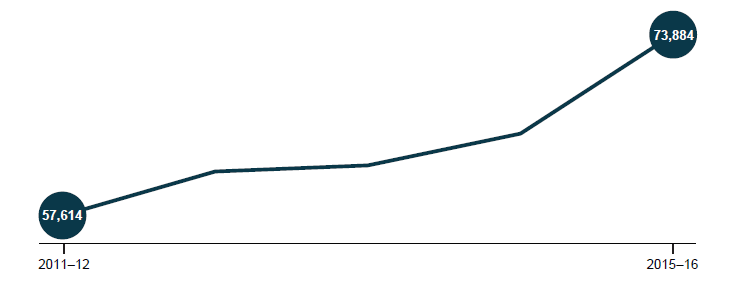
Growing demand for end-of-life care
The ageing population, and rising rates of cancer and other chronic conditions, has led to a rise in palliative care services. Palliative care includes practices that aim to relieve suffering and improve the quality of life for people with a life-threatening condition and their families.
Over the 4 years to 2015–16:
- palliative care provided in hospitals rose by 28%
- the rate of subsidised palliative care-related prescriptions rose at an average annual rate of 17%.
Hospitalisations for palliative care over time
Find out more: Chapter 7.21 ‘Palliative care services’ in Australia’s health 2018.
How do we measure safety and quality of care?
Safety and quality in health care is about being able to receive the right care, in the right place, at the right time, and for the right cost. This can be monitored and measured in a number of ways, including by looking at:
- how health care varies across geographic areas
- potentially preventable hospitalisations
- adverse events in hospitals.
Potentially preventable hospitalisations are conditions for which hospitalisation is considered potentially avoidable if timely and adequate non-hospital care had been provided, either to prevent the condition occurring, or to prevent the hospitalisation.
Adverse events are incidents where harm resulted to a person receiving health care. They include infections, injuries from falls, and problems with medication and medical devices.
| 2007–08 | 2015–16 | |
|---|---|---|
| Potentially preventable hospitalisations (per 1,000 population) | 25.8 | 26.4 |
| Adverse events in hospitals (per 100 hospitalisations) | 4.8 | 5.4 |
Find out more: Chapter 1.4 ‘Indicators of Australia’s health’, 7.9 ‘Safety and quality of hospital care’ and 7.16 ‘Variation in health care provision’ in Australia’s health 2018.
What do patients think about their care?
Asking patients what they think of the health care they receive is another way to improve the quality of services.
In 2016–17:
- nearly 1 in 5 (18%) people aged 15 and over felt they waited longer than acceptable to see a GP
- 63% were able to see a GP within 4 hours of making an appointment for urgent medical care, but one-quarter (25%) waited 24 hours or more.
21% of people aged 15 and over felt they waited longer than acceptable to see a medical specialist in 2016–17
In 2016, 96% of surveyed people aged 45 and over said they received excellent, very good or good quality care from their usual GP.
In addition to general health surveys, the Your Experience of Service survey has been adopted in some parts of the public mental health sector. It aims to help mental health services and consumers work together to build better services.
The survey is currently used in New South Wales, Victoria and Queensland, and in each state two-thirds or more of the people surveyed rated their experience as very good or excellent in the survey period.
- In Victoria, 65% of people who attended a clinical mental health service in the previous 3 months, rated their experience as excellent or very good.
- In New South Wales, 39% of people rated their overall experience as excellent and 28% as very good.
- In Queensland, 44% of people rated their overall experience as excellent, and 26% as very good.
Find out more: Chapter 7.17 ‘Patient-reported experience and outcome measures’ and 7.18 ‘Coordination of health care’ in Australia’s health 2018.
Who works in health care?
In 2016, more than 800,000 people said they worked in hospital, medical and other health care services. This includes clinical and other health and administrative support staff, and is a 19% rise from 674,000 in 2011.
In 2016, most of the employed registered health professionals were nurses and midwives (315,000) and medical practitioners (91,000), which includes GPs and specialists. Nine in 10 nurses are women, compared with 4 in 10 medical practitioners and dentists. The number of women entering medical practice has risen over the past decade. In 2016, more than half (53%) of employed medical practitioners under the age of 35 were women, compared with 43% in 1997.
| Profession | Female-to-male ratio | Per cent |
|---|---|---|
| Nurses and midwives | 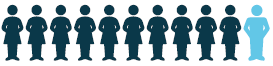 |
89% |
| Medical practitioners | 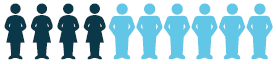 |
41% |
| Psychologists | 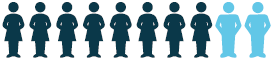 |
79% |
| Physiotherapists | 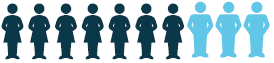 |
66% |
| Dentists |  |
41% |
Find out more: Chapter 2.3 ‘Who is in the health workforce?’ in Australia’s health 2018.
Health in the digital age
Today, many Australians use digital technology to monitor their own health. They might wear a fitness device to record how much exercise they do, or use a smartphone to keep track of what they eat. For health care providers, digital technology can provide opportunities to improve continuity of care.
- 86% of households have internet access
- 88% of people aged 18–75 own or have access to a smartphone
- 78% of adults use the internet to find health-related information
- 96% of GPs use computers for clinical purposes
- 23% of Australians had a My Health Record in March 2018—by the end of 2018, all Australians will have a My Health Record unless they opt out
My Health Record is one of the Australian Government’s digital health priorities. The online platform stores a person’s health information, including their Medicare claims history, hospital discharge information, diagnostic imaging reports, and details of allergies and medications. The person, and their authorised health care providers, can then access these details securely at any time.
Find out more: Chapter 2.4 ‘Digital health’ and 2.5 ‘Secondary use of health information’ in Australia’s health 2018.