Disease/injury-specific summary *NEW*
Use the interactive graphs to generate a summary of total burden (DALY) in Australia in 2018 for a specific disease or injury.
How to use the interactive visualisation
- Select a specific disease or injury using the drop-down list to filter the data displayed in the visualisation.
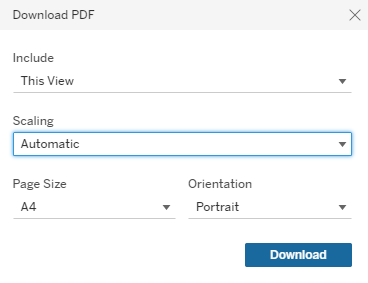
- Click on the ‘Download PDF’ button to download a 1 page PDF for the selected disease/injury.

- Select A4 in the Page Size drop-down.
- An alternative is to use the ‘Download’ button at the bottom of the dashboard to generate image (PNG) or PDF versions of the dashboard.

See Chapter 2 in the Australian Burden of Disease Study: impact and causes of illness and death in Australia 2018 report for more information on total burden (DALY) estimates by disease and injury.
This interactive data visualisation reports on a range of statistics on the burden of a specific disease or injury in Australia, which can be selected by the user. There are a number of sentences reporting the amount and rate of total, fatal and non-fatal burden due to the disease or injury; the proportion of total burden which is due to fatal and non-fatal burden; and the age-standardised rates of total, fatal and non-fatal burden by sex and year (2003, 2011, 2015 and 2018). There are 4 column charts showing the amount and rate of total burden for males and females by 5-year age groups. There is a column chart showing the age-standardised rates of total burden by state and territory and for the whole of Australia. There are 2 tables which show the age-standardised rates of total burden by remoteness areas and by socioeconomic group and for the whole of Australia. The cells of the table are shaded to indicate whether the rate is equal or lower than the national average or the degree to which the rate is higher than the national average.
