Remoteness areas
Disease burden was estimated by remoteness areas for 2011, 2015 and 2018.
Remoteness is divided into Major cities, Inner regional, Outer regional and Remote and very remote defined by an area’s relative access to services.
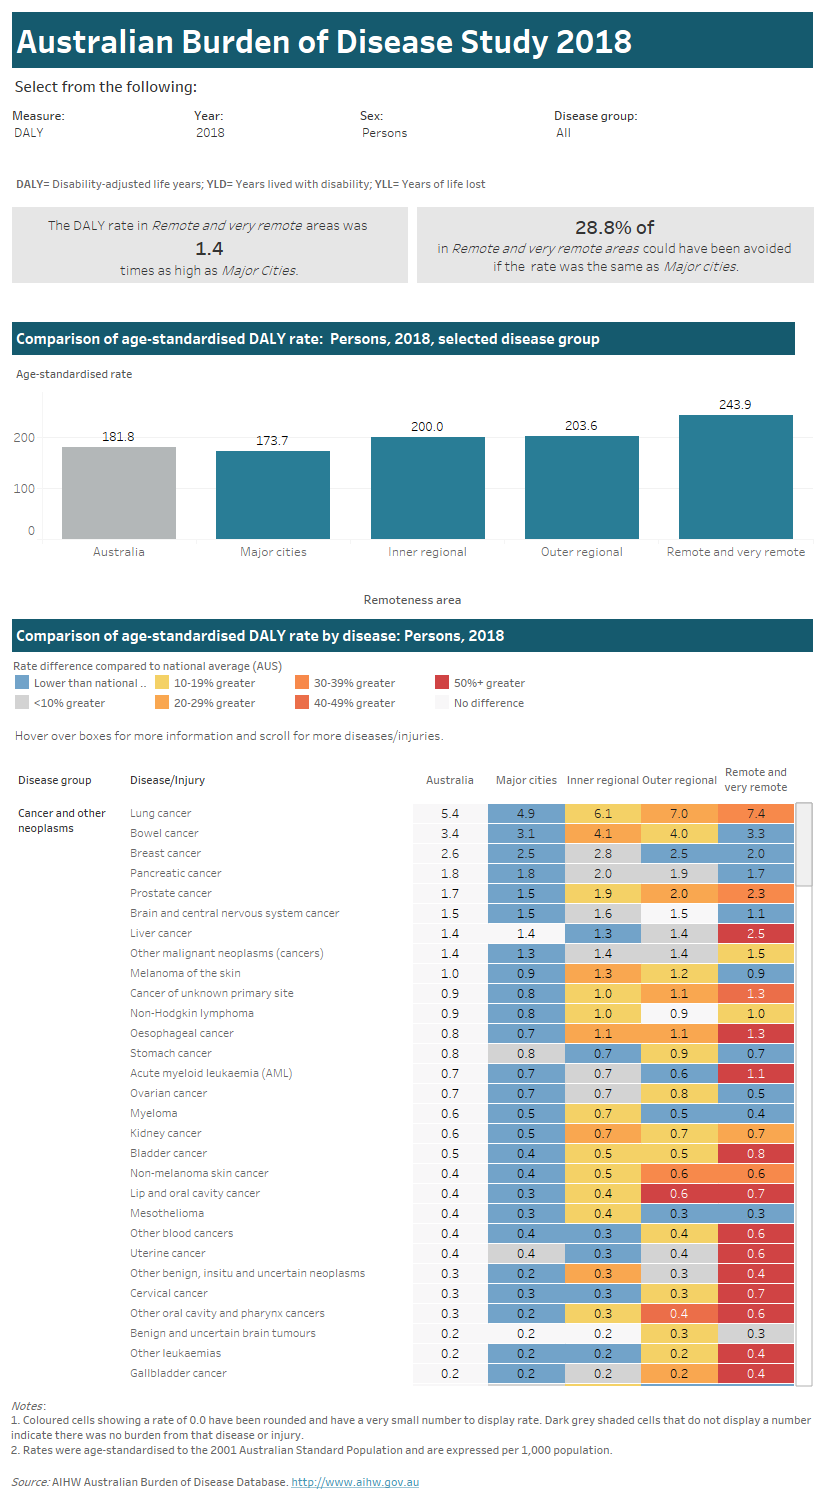
The key results include estimates of excess burden. Excess burden refers to the reduction in disease burden that would occur if all areas experienced the same rate of burden experienced in Major cities. In the data visualisation the key results show the excess burden if Remote and very remote areas experienced the same rate of burden experienced in Major cities (shown in the grey box on the right).
The table showing age-standardised rates compares the remoteness areas with the national average (Australia) and colours the cells if lower (blue) or higher (yellow, orange or red).
Use the interactive graphs to explore the number and rate of disease burden (DALY, YLD or YLL) across remoteness areas for disease groups in 2011, 2015 or 2018 by sex.
See Chapter 8 in the Australian Burden of Disease Study: impact and causes of illness and death in Australia 2018 report for more information on burden by remoteness area.
This interactive data visualisation compares burden of disease in Australia by remoteness area. There are 3 sections which can be customised to report data according to type of burden, year, sex and disease group. The first section has two sentences. The first sentence reports how many times higher the rate was in Remote and Very Remote areas compared to Major Cities for the selected type of burden, year, sex and disease group. The second sentence reports what proportion of burden could have been avoided if Remote and Very Remote areas had the same rate of burden as Major Cities for the selected type of burden, year, sex and disease group. The second section is a column chart which reports the age-standardised rate of burden (per 1,000 population) for each remoteness area and of the whole of Australia for the selected type of burden, year, sex and disease group. The third section is a table which reports the age-standardised rates of burden (per 1,000 population) of each remoteness area and of the whole of Australia for each of the specific diseases within the disease group selected and according to the type of burden, year and sex selected. Cells of the table are shaded to indicate whether the rate is equal or lower than the national average or the degree to which the rate is higher than the national average.

Please use the ‘Download’ button at the bottom of the dashboard to generate image or PDF versions of the data.


