Drivers of change in disease burden

Frequently asked questions
How should the drivers of change over time analyses and charts be interpreted?
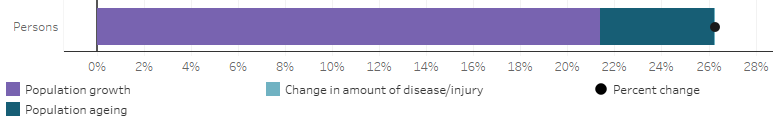
The figure below is provided to help readers interpret the analyses and charts presented in this web release. Each factor included in the drivers of change over time analyses (population growth, population ageing and amount of disease/injury) may cause the overall disease burden to increase (indicated by a positive percent change) or decrease (a negative percentage change) over time. The sum of the effect of all factors represents the overall change in disease burden between 2003 and 2018.
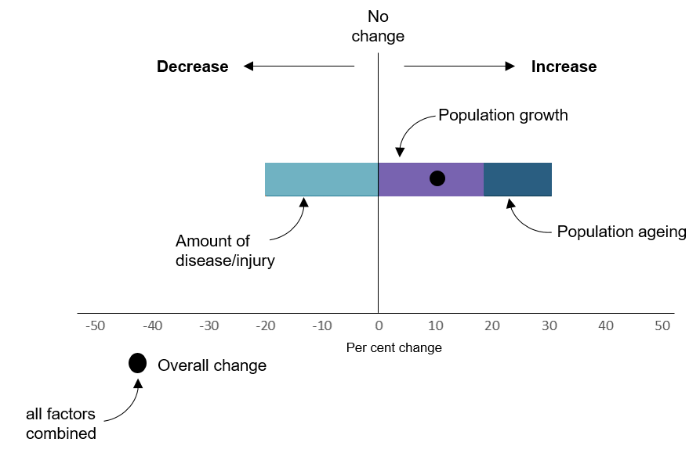
Put simply, these analyses show that if the overall burden due to a disease or injury is increasing (i.e. getting worse), we can see which factors are most responsible for this increase and target policy and program responses accordingly.
How are the estimates of drivers of change over time calculated?
The Das Gupta method was used to decompose the changes in burden attributable to each disease group, disease or injury into 3 additive components (Das Gupta 1993). Using a series of scenarios this method calculates the effect of each factor on the changes over time by assuming that all other factors, except the factor under consideration, remain the same at both time points. This provides an indication of the proportionate impact of the specified factors (assuming any other unspecified factors are small and independent of the specific factors). The method distributes the interaction effects (such as the relationship between an ageing population and disease burden) between the factors in proportion to the strength of the main effects (Zhai et al. 2017). This differs to the stepwise approach which requires a logical order to be chosen for the factors to be included in the analyses, and would give a different result if the factors are included in a different order.
The change in overall disease burden is decomposed into changes due to:
- population growth—in Australia population size is increasing over time
- population ageing—in Australia the proportion of older people is increasing over time
- change in amount of disease/injury—estimated by the prevalence of the disease, the number of deaths and the average age at death. This can be influenced by changes in diagnosis, treatment or survival (resulting in increases or decreases in prevalence and changes in the severity of the disease), and variation in exposure to risk factors linked to the disease.
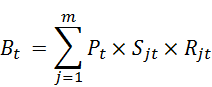
Burden is estimated as the product of these 3 factors using the formula:
where
Bt is the amount of burden (DALY, YLL or YLD) for a particular disease group, disease or injury at time point t.
j is an age and sex group
m is the age and sex groups included (males and females aged 0 to 100+)
t is a time point
Pt is the total population size at time t
Sjt is the share of the population in age and sex group j at the time t
Rjt is the rate burden for disease/injury in the age and sex group j at the time t.
∑ is the sum of all the age and sex groups j
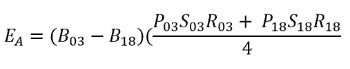
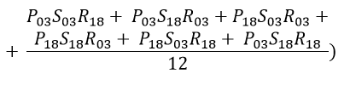
The effect of each of the 3 factors—population size, population ageing and disease amount—using this method on the change in disease burden between 2003 and 2018 is calculated as:
where
EA is the effect of factor A (population size, population ageing and disease burden)
B is the amount of burden (DALY, YLL or YLD) due to disease/injury or disease group in 2003 (B03) in 2018 (B18)
P is the population size in 2003 (P03) or in 2018 (P18)
S is the population age structure in 2003 (S03) or in 2018 (S18)
R is the rate burden of the disease/injury of disease group in 2003 (R03) or in 2018 (R18)
What are the limitations of the methods used in this analysis?
Only factors that could be easily measured (population ageing, population growth and changes in disease/injury) were included in these analyses. However, these are considered to be among the most important drivers of change in disease burden over time. It is not possible to include other factors in the analyses that may also have an impact on changes in disease burden over time as they are not able to be quantified.
Using this methodology, it was not possible to estimate the contribution of risk factor exposure to the change in total disease burden for each disease/injury. Analysis to estimate the contribution of risk factor exposure to the change in attributable burden, however, has been undertaken and this can be found in Risk factor attributable burden: drivers of change over time.
How do these estimates of drivers of change compare to age-standardised rates?
Both age-standardised rates (which use a 'standard' population to produce rates that can be compared independent of the age structure of the study population(s)) and the drivers of change estimates presented here are methods used to compare rates over time, while taking into account the differing age structures (population ageing) of the population over time.
The percent change in age-standardised rates over time is somewhat comparable to the measure of percent change due to the amount of disease/injury in the drivers of change estimates. However, the advantage of the drivers of change estimates is that they provide an indication of the proportionate impact of each of the specified factors, not just the change in age-standardised population rates. A disadvantage of age-standardised rates is that they are only useful for the purposes of comparison with other standardised rates which have used the same reference population. Once standardised, the rates no longer reflect the actual rate observed in the population.
How accurate are the estimates for changes in disease/injury over time?
The accuracy of the estimates for changes in disease/injury over time are impacted by the quality of the mortality and morbidity data used in the calculation of the fatal (YLL) and non-fatal burden (YLD) estimates underpinning these calculations.
For fatal burden (YLL) estimates, there have been notable changes in cause of death coding practices over time for dementia and accidental poisoning and these estimates should be interpreted with caution.
For non-fatal burden (YLD) estimates, morbidity data were drawn from a wide variety of sources, with varying availability and data quality over time. Refer to the Quality information for YLD estimates for further information.
Why is there no change in the amount of disease/injury over time for some diseases?
For some diseases/injuries in ABDS 2018, data were not available on changes in prevalence over time, and based on expert advice the same age-specific prevalence rates were applied in each year (2003, 2011, 2018) of the study. As a result, there is a ‘0%’ value shown in the visualisations for the ‘amount of disease/injury’ for YLD. The overall percentage change is driven by population ageing and population growth alone. These diseases/injuries highlight data gaps and areas for future improvement and include many of the mental and substance use disorders (anxiety disorders, alcohol use disorders, bipolar affective disorder, depressive disorders, schizophrenia), as well as Parkinson disease and dermatitis and eczema.
References
Das Gupta P 1993. Standardization and decomposition of rates: a user's manual. U.S. Bureau of the Census, Current Population Reports, Series P23-186. Washington, DC: U.S. Government Printing Office.
Zhai T, Goss J, Li J 2017. Main drivers of health expenditure growth in China: a decomposition analysis. BMC Health Services Research 17(1): 185. doi:10.1186/s12913-017-2119-1. https://doi.org/10.1186/s12913-017-2119-1
Acknowledgments
The authors would like to acknowledge John Goss and Jinjing Li from the University of Canberra for providing us with an analytical tool and advice to be able to break down results over time, using the method developed by Prithwis Das Gupta.