Overview
Burden of disease measures the gap between a population’s actual health and the ‘ideal’, where everyone lives in full health to an ideal age. Disease burden is measured using the summary measure of disability-adjusted life years (DALY). DALY caused by premature death (fatal burden), are known as ‘years of life lost’ (YLL) and are measured against an ideal life expectancy of 86 years. DALY caused by living in poor health (non-fatal burden) are known as ‘years lived with disability’ (YLD). YLD are weighted by severity of disease to consider the different impacts of different diseases. 1 DALY is equivalent to 1 year of healthy life lost and is equal to YLL plus YLD.
The Australian Burden of Disease Study (ABDS) 2018 provides the most recent Australian-specific estimates of disease burden in Australia. These pages present information on the burden among Aboriginal and Torres Strait Islander people. Data on burden of disease in the total Australian population can be found in the Australian Burden of Disease Study 2018: Impact and causes of illness and death in Australia report and in the Interactive data on disease burden. Estimates for Aboriginal and Torres Strait Islander people are available by age and sex for 17 disease groups, 219 diseases and injuries and for selected population groups (state/territory, remoteness areas, and socioeconomic group). In addition, changes between the years 2003, 2011 and 2018 can be explored.
Estimates for 2011 and 2003 from the ABDS 2018 replace the estimates for these years, which were published as part of the ABDS 2011. Estimates in the two studies (ABDS 2011 and ABDS 2018) differ due to updates in disease-specific methodology.
The interactive data visualisations complement the ABDS 2018 detailed PDF reports and summary reports by enabling users to explore the data in more detail and filter/customise the data and figures to meet their information needs.
Use the interactive graph below to explore the leading causes of disease burden among Aboriginal and Torres Strait Islander people by age group and disease group for 2018. Data visualisations displaying estimates of disease burden due to various risk factors are available in the interactive web report: Interactive data on risk factor burden.
What is included in the interactive Indigenous burden of disease data visualisations?
The Indigenous Burden of Disease Study 2018 data visualisation tool includes estimates of total, non-fatal and fatal burden, as well as deaths among Indigenous Australians for:
- Australia in the years 2003, 2011 and 2018
- States and territories for 2011 and 2018 (New South Wales, Queensland, Western Australia and the Northern Territory)
- Remoteness area and socioeconomic group for 2011 and 2018
- Gap in health outcomes for Indigenous and non-Indigenous Australians including changes over time
- Information about the quality of data and methods used to generate estimates
- Frequently asked questions on methods, data sources and definitions
- Further information to assist interpretation of the results is shown when hovering over the information icons.
Navigating the dashboards

The toolbar at the bottom of the data dashboards enables users to interact with the data in different ways:
- Undo = Undo the filter
- Redo = Redo the filter
- Revert = Clears all filters and reverts visualisation to defaults
- Refresh = Refreshes the data
- Pause = Pauses the data (filters do not work if this button is selected)
- Share = Generates a link that can be shared (note that filters will not be applied when link is shared)
- Download = Allows a downloadable file as either an image (PNG), PDF or PowerPoint file. This is a useful way to save snapshots of the data to include in a document or presentation.
- Full screen = Displays the dashboard in full screen mode (press Esc to return to original view)
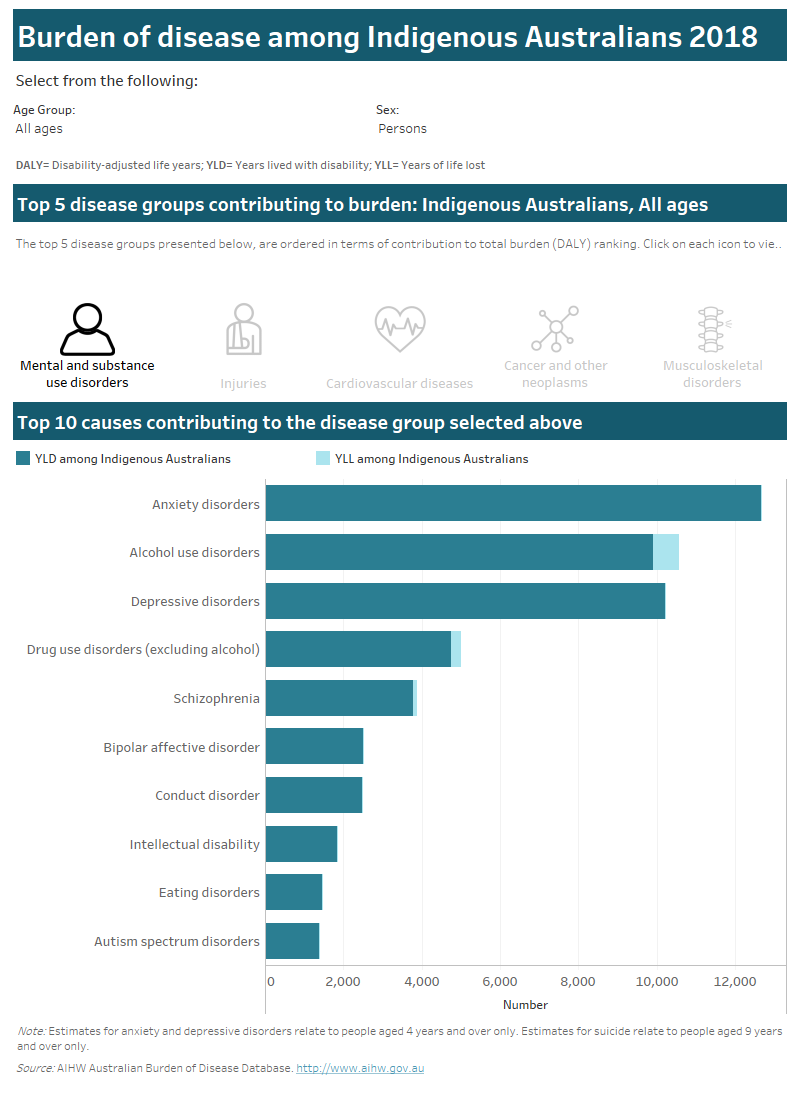
This interactive data visualisation gives an overview of the leading causes of burden of disease in Australia for 2018. There are 2 sections which can be customised to report data according to age group and sex. The first section are disease group icons, for the leading 5 disease groups contributing to total burden (DALY). These icons act as a filter for the second section, which is a stacked bar chart. The stacked bar chart reports the amount of burden among Indigenous Australians for the disease group selected, by disease cause. Each bar is split into fatal burden (number of YLL) and non-fatal burden (number of YLD).

Please use the ‘Download’ button at the bottom of the dashboard to generate image or PDF versions of the data.


