State and territory estimates
This section focuses on the variability of burden across states and territories, rather than the detailed estimates for each jurisdiction. Variations may reflect not just differences in mortality (deaths) and morbidity (illness) but a complex interaction of a number of other factors, such as demographic (including the age structure of the population and the proportion of the population that is Indigenous) and socioeconomic variations.
Disease burden, as well as the gap in burden, among Aboriginal and Torres Strait Islander people in 2018 and 2011 are presented by sex, age group and disease group for 4 states and territories: New South Wales, Queensland, Western Australia and the Northern Territory. Data are not presented for Victoria, South Australia, Tasmania and the Australian Capital Territory, due to issues relating to the calculation of Indigenous YLL estimates (which are also used in the calculation of DALY estimates). This includes the small number of Indigenous deaths reported for these jurisdictions each year, and individual mortality adjustment factors not being available from the ABS for these states and territories.
Use the ‘State/territory estimates’ interactive graphs to explore disease burden (DALY, YLD or YLL) by age and sex in each of the 4 jurisdictions for disease groups of interest. Use the ‘State/territory comparison’ interactive graphs to explore disease burden (DALY, YLD or YLL) across the 4 jurisdictions for disease groups by sex for 2018 and 2011.
See Chapter 10 in the Australian Burden of Disease Study 2018: impact and causes of illness and death in Aboriginal and Torres Strait Islander people report for more information on estimates by state and territory.
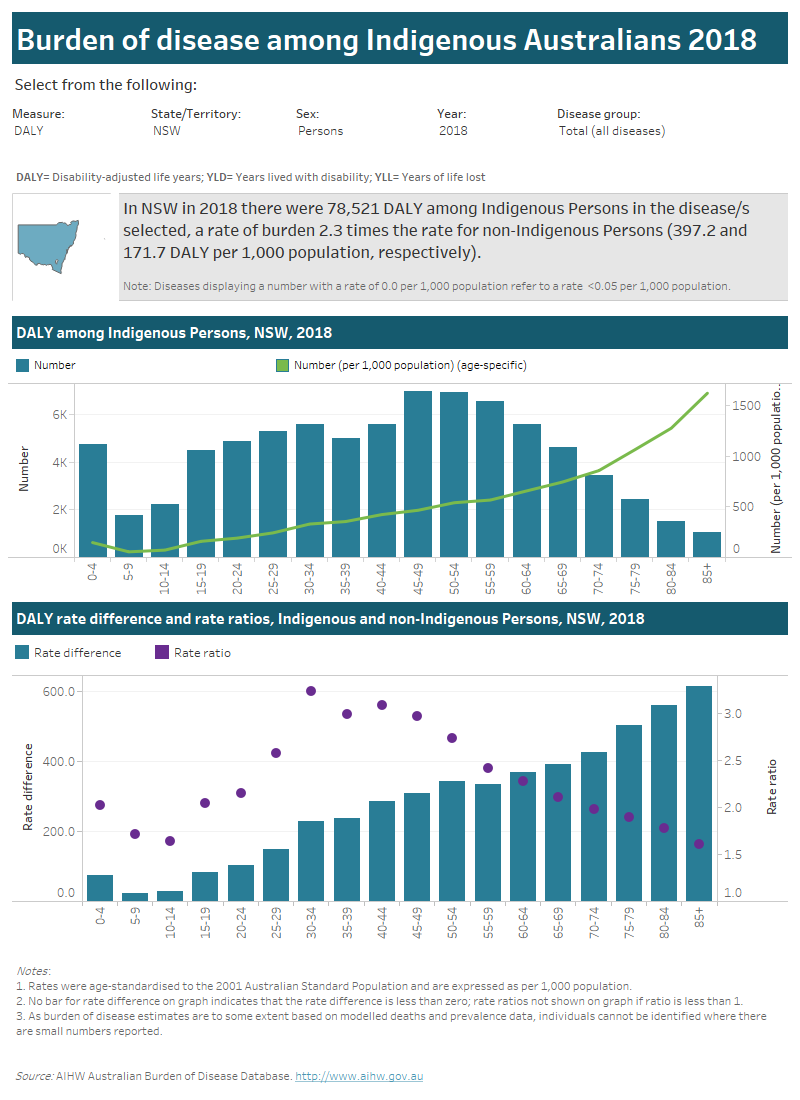
Tab 1: This interactive data visualisation gives an overview of burden of disease among Indigenous Australians by state and territory. There are 3 sections which can be customised to report data according to state or territory, type of burden, year, sex and disease group. The type of burden presented include total burden (DALY), years of life lost (YLL), and years of life lived with disability (YLD). The first section is a sentence which reports the total amount and rate of burden (per 1,000 population) for the selected state or territory, type of burden, year, sex and disease group. The second section is a column chart which reports the amount of burden by 5-year age groups for the selected state or territory, type of burden, year, sex and disease group. A line graph is superimposed on the column chart to show the age-specific rate of burden (per 1,000 population) by 5-year age groups. The third section is a column chart which reports the rate differences and rate ratios, between Indigenous and non-Indigenous Australians, by 5-year age group, for the selected type of burden, state/territory, sex, year and disease group.
Tab 2: This interactive data visualisation compares the age-standardised rates of burden (per 1,000 population) among Indigenous Australians for the 4 state and territories reported and for the whole of Australia. The type of burden presented include total burden (DALY), years of life lost (YLL), and years of life lived with disability (YLD). There are 2 sections which can be customised to report data according to type of burden, year, sex and disease group. The first section is a column chart which reports the age-standardised rate of burden (per 1,000 population) for each state and territory and for the whole of Australia for the selected type of burden, year, sex and disease group. The second section is a column chart which reports the rate difference and rate ratio, between Indigenous and non-Indigenous Australians, for each state/territory and Australia, for the selected type of burden, year, sex and disease group.

Please use the ‘Download’ button at the bottom of the dashboard to generate image or PDF versions of the data.


