Technical notes
Overarching methods
General methods for estimation of burden of disease can be found in Australian Burden of Disease Study: methods and supplementary material 2018. This includes descriptions for years of life lost (YLL), years lived with disability (YLD), disability-adjusted life years (DALY) and health-adjusted life expectancy (HALE).
How the Australian Burden of Disease Study 2023 differs from previous studies
The ABDS 2023 is different to the 2003, 2011, 2015 and 2018 studies in that estimates have been produced for the current year (2023). It builds on work from the ABDS 2022, which was the first study where burden was estimated for the year of release (2022). ABDS 2023 includes disease burden estimates for the year of release (2023) for 220 diseases and injuries, including estimates of burden for COVID‑19. This Study provides burden of disease estimates best matched to the public health context for the Australian population for 2023.
Updates to estimates for specific mental health conditions
The National Survey of Mental Health and Wellbeing (NSMHW) is the key data source of measured prevalence for a number of mental and behavioural disorders in Australia for persons aged 16–85 years. This includes lifetime and 12-month diagnoses based on DSM-IV and ICD criteria using the World Mental Health Survey Initiative version of the World Health Organisation’s Composite International Diagnostic Interview Version 3.0 (WMH-CIDI 3.0) adjusted for the Australian context. In previous ABDS, the latest available survey was the 2007 NSMHW.
At the time of analysis, the NSMHW 2020-21 (Cohort 1) was the most recent source of prevalence data for depressive disorders, anxiety disorders, bipolar affective disorder and alcohol use disorder. Therefore, burden estimates for these conditions were updated using data from the NSMHW 2020-21 unless the lower sample size was an issue (for example, age distributions from the NSMHW 2007 survey were used due to low unweighted counts resulting in no or very minimal age distributions being derived from the NSMHW 2020-21).
In addition to the release of the NSMHW 2020-21 (Cohort 1), the Intellectual Disability Exploring Answers (IDEA) data has been linked to the National Disability Insurance Scheme (NDIS), resulting in higher ascertainment of individuals with autism spectrum disorders. Estimates for 2018 were revised to allow comparisons with 2023 estimates, however, estimates for 2018 and 2023 are not comparable to estimates for 2015 and earlier due to the addition of a new ascertainment source to the IDEA.
Calculation of estimates
2023 estimates
Estimates of YLL for 2023 were largely based on deaths occurring from 2011 to 2021. The ABS provisional deaths for January to June in 2023 was used to validate and adjust projected deaths where appropriate. For each disease, one of the following projection methods was used to estimate burden in 2023:
- log-linear regression (also called Poisson regression or Poisson linear regression)
- ordinary least-squares regression (also called simple linear regression)
- sex- and age-specific crude rates assumed to be the same between the year with the latest available data (for example, 2021 for YLL) and 2023.
For some diseases, the reference period used to inform the trend was restricted (for example, 2011–2019). For example, for diseases (for example, lower respiratory infections including influenza and road traffic injuries) that were largely impacted by COVID‑19, estimates for 2020 were not included as 2020 did not resemble a typical mortality year (ABS 2020). Other years were excluded where data were considered inappropriate for use in trend analysis, such as due to coding changes, or where data in early years were not robust. See the following section for examples of coding changes for selected diseases and how this affected trend analyses.
Examples of changes to disease coding and guidelines over time
Substance use disorders and accidental poisoning
In 2014, the ABS implemented the use of new software for coding causes of death, applied International Classification of Diseases 10th revision (ICD-10) updates and reviewed coding practices. These processes impacted the cause of death output from 2013 onwards. Previously, for substance use disorders, where a death was due to an accidental drug overdose for a person with a known addiction to the drug, the addiction was reported as the underlying cause of death (that is, codes F10–F19 Mental and behavioural disorders due to psychoactive substance use). Since the coding changes, the drug overdose is captured as the underlying cause of death (X40–X49 Accidental poisoning) and the addiction is retained as an associated cause of death. The result was an increase in deaths due to Accidental poisoning, and a decrease in the number of deaths due to Mental and behavioural disorders due to psychoactive substance use. These changes will have an impact on comparisons made between 2003 or 2011 and 2015, 2018 or 2023, but not on those made between 2003 and 2011, or between 2015 and 2018 or 2023.
To account for these changes, the 2023 projected estimates of fatal burden (YLL) of substance use disorders were based on trend analysis starting from 2013.
Dementia and stroke
The number of deaths due to dementia has increased when comparing data before 2006 with data from 2006 onwards. This increase can be attributed to: (1) changes in ICD-10 instructions for coding deaths data, which have resulted in assigning some deaths to vascular dementia (F01) that may previously have been coded to cerebrovascular diseases (stroke) (I60–I69), and (2) the increase in reporting dementia as the underlying cause of death accompanied by the decrease in reporting of dementia as an associated cause (Buckley et al. 2019), and (3) legal changes allowing veterans and members of the defence forces to relate death from vascular dementia to relevant service. This, along with an accompanying promotional campaign targeted at health professionals, is thought to have increased the reported number of dementia deaths among this group (ABS 2014). These changes will have an impact on comparisons made between 2003 and 2011, 2015, 2018 or 2023, but not on those made between 2011 and 2015, 2018 or 2023.
To account for these changes, the 2023 burden estimates (both YLL and YLD) for dementia and stroke were based on trend analysis starting from 2011.
Gestational diabetes
The International Association of the Diabetes and Pregnancy Study Groups (IADPSG) developed a new consensus guideline for the testing and diagnosis of gestational diabetes in 2010. In 2014, the endorsement of the IADPSG guidelines by the Australasian Diabetes in Pregnancy Society (ADIPS) resulted in a significant change to the practice of testing and diagnosing gestational diabetes in Australia (AIHW 2019). Reflecting international trends, Australian studies found increases in the number of women diagnosed with gestational diabetes following the introduction of the IADPSG guidelines between about 2010 and 2014, of 20% (Laafira et al. 2015), 35% (Moses et al. 2011) and 74% (Cade et al. 2019). A steep increase of the incidence of gestational diabetes was recorded from 2012–13 (AIHW 2019). These changes will have an impact on comparisons made between 2003 or 2011 and 2015, 2018 or 2022, but not on those made between 2003 and 2011, or between 2015 and 2018 or 2023.
To address this change, the 2023 non-fatal burden (YLD) estimates of gestational diabetes were based on trend analysis starting from 2015, which was the closest starting point amongst available Australian Burden of Disease Study (ABDS) estimates.
The COVID‑19 pandemic presents an important consideration for the selection of appropriate models given its impacts on the input data sources available, the health system or the disease/injury itself. For example, disease estimates that would otherwise rely on health surveys or screening data sources were likely to be impacted due to restrictions and lockdowns in reference years following the onset of the pandemic. Therefore, selected regression models take into account factors beyond indicators of best fit and incorporate an assessment of appropriateness in consideration of the pandemic data environment. Projections using model inputs only up to and including the year 2019 (that is, prior to the pandemic), are available upon request.
Two regression models were used to accommodate different annual patterns of diseases. The Poisson regression assumed that rates changed at a constant per cent annually, whereas the simple linear regression assumed a constant fixed amount of change (for example, 10 YLD) every year (NCI 2022).
COVID‑19 was added to the ABDS 2022 as a new disease, and has since been included in the ABDS. Lower respiratory infections (including influenza and pneumonia) estimates were derived using the most recent available data for 2023. Further details on these diseases, including caveats and assumptions, are presented in the following sections.
Earlier reference years
Estimates between 2003 and 2018 followed the methodologies developed for ABDS 2018 (AIHW 2021a).
ABDS 2023 used revised mortality data to calculate single-year estimates for YLL from 2011 to 2021 in the trend analysis to reflect changes in mortality coding under the ABS revisions process and to obtain estimates for years in between the ABDS reference years. Updated YLL estimates were used across the years in trend analyses, as the ABS revises mortality information for coroner-certified deaths to improve the accuracy of the coding. These revisions do not increase the overall number of deaths in any year but may change the distribution of the causes of death. Further information on the ABS mortality revisions process is available on the ABS website.
Estimation of COVID‑19 for 2023
Fatal burden
Methods for calculating fatal burden (expressed as YLL) of COVID‑19 used the number of deaths directly due to COVID‑19, the ages at which these deaths occurred, and the Global Burden of Disease Study (GBD) standard reference life table.
Definition and coding of COVID‑19 deaths
In the International Classification of Diseases 10th revision (ICD-10), COVID‑19 deaths are coded to:
- ICD-10 code U07.1 – COVID‑19 virus identified is used when COVID‑19 is confirmed by laboratory testing.
- ICD-10 code U07.2 – COVID‑19 virus not identified is used for suspected or clinical diagnoses of COVID‑19 where testing is not completed or inconclusive.
- ICD-10 code U10.9 – Multisystem inflammatory syndrome associated with COVID‑19. This code is used to identify people who have died from a multi-inflammatory response syndrome associated with COVID‑19.
- ICD-10 code U09.9 – Post COVID‑19 condition. This code is used to link long term conditions including chronic lung conditions that are the result of the virus. These deaths are included as associated cause of death.
In ABDS 2023, deaths coded to U07.1, U07.2 and U10.9 as the underlying cause of death (death directly due to COVID‑19) were included in estimating fatal burden.
Data sources
COVID‑19 deaths for 2023 were sourced from the ABS death registration data, which is the official Australian deaths data collected via the state/territory Registrars of Births, Deaths and Marriages. It includes death registration data and medical cause of death information completed by a certifying medical practitioner and is considered a high-quality data source. In early-mid 2020, the ABS started releasing provisional deaths data to monitor the impact of the COVID‑19 pandemic. Further information about the completeness and timeliness of the ABS provisional deaths data is available on the ABS website.
Estimating fatal burden in 2023
Doctor and coroner-certified COVID‑19 deaths by single year age between January and July 2023 were provided by the ABS. As the ABS data were incomplete for June and July 2023, data were inflated to account for incompleteness. The monthly changes of COVID‑19 deaths were modelled from previous year but adjusted with an assumption of a gradual decline to December.
The estimated COVID‑19 deaths for 2023 were disaggregated by age and sex, using the age and sex distributions from the provisional deaths provided by the ABS. The standard reference life table was then applied to the estimates to derive the YLL at each age.
Non-fatal burden
Conceptual model
The conceptual model for COVID‑19 is shown in Figure 4.1, which was the consensus model being used by the European Burden of Disease Network (EBDN 2020) to calculate non-fatal burden due to COVID‑19 at the time of analysis. Important components of the YLD model which result in health loss (Figure 4.1) include:
- Mild/moderate cases: correspond to those not requiring hospitalisation to treat their disease. It is noted that some cases in Australia were hospitalised to maintain strict isolation rather than because of the severity of their disease (particularly at the start of the pandemic).
- Severe cases: correspond to those hospitalised to treat their disease, but not requiring admission to intensive care units (ICU).
- Critical cases: correspond to people who were treated in ICU.
- Post-acute consequences: correspond to cases with post COVID‑19 condition (also known as ‘long COVID’). As evidence continues to emerge alongside a changing COVID‑19 landscape in Australia, a more detailed method for quantifying long COVID non-fatal burden was developed for ABDS 2023.
Permanent functional impairment from COVID‑19 was not included in this Study due to a lack of data. More elapsed time is needed to understand these potential consequences.
Figure 4.1: Conceptual model for COVID‑19 burden of disease analysis
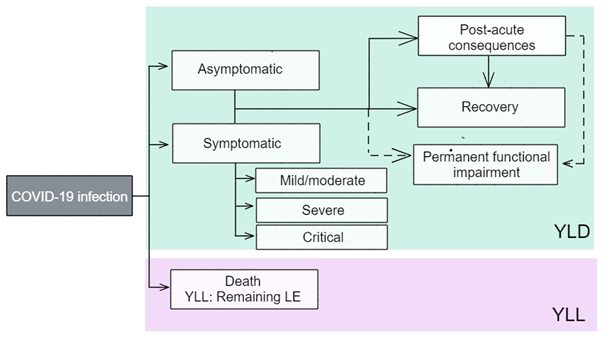
LE = life expectancy; YLD = years lived with disability; YLL = years of life lost.
Source: EBDN 2020.
Model parameters: disability weights and disease durations
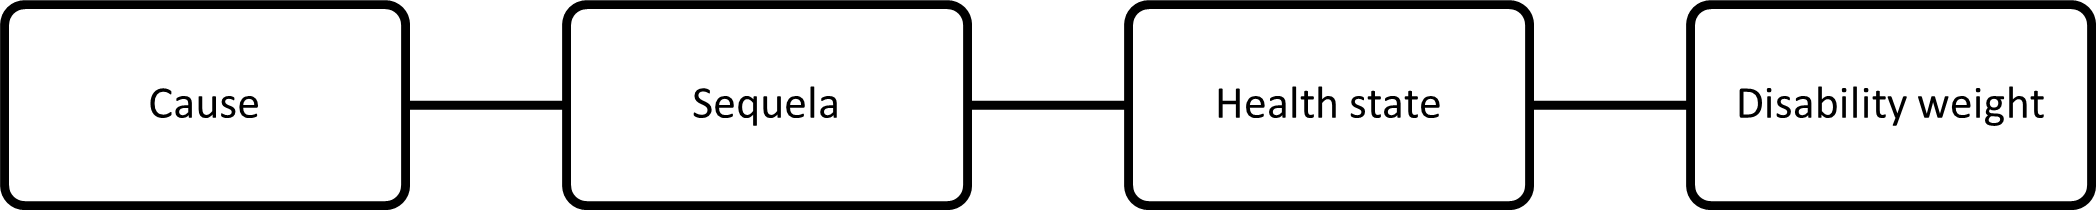
The ‘disability weights’ reflect the severity of the disease and correspond to a ‘health state’ which describes the average experience for people at that severity level. As is the usual approach in the ABDS, the use of GBD disability weights was prioritised. However, an additional disability weight (for critical cases) sourced from the European Disability Weight survey (Haagsma et al. 2015) was used as no corresponding disability weight was available from the GBD at the time of analysis.
Table 4.1 outlines the disability weights for each health state. Disability weights were drawn from EBDN 2020 except for post-acute consequences, which was derived from aggregated disability weights based on data from Howe et al. (2023).
It is important to note that in this Study:
- Asymptomatic cases have no disability weight as these cases are considered to have no health loss. The possible burden of isolation and worry of potential transmission to family members is not counted.
- The model may change in future studies as more evidence and data on COVID‑19 and long COVID emerge. The Australian Institute of Health and Welfare (AIHW) continues to liaise with the COVID‑19 Epidemiology and Surveillance Team at the Department of Health and Aged Care and the EBDN, as well as review other sources (for example, GBD) and assess international developments in the model for long COVID.
Health state type | Severity level | Health state | Disability weight | Durations |
|---|---|---|---|---|
Acute infectious disease | Asymptomatic | Has infection but experiences no symptoms | Nil | Nil |
| Mild/moderate | Has a fever and aches, and feels weak, which causes some difficulty with daily activities | 0.051 | 7 days |
| Severe | Has a high fever and pain, and feels very weak, which causes great difficulty with daily activities | 0.133 | Average length of stay |
| Critical | Intensive care unit admission | 0.655 | Average length of stay |
Chronic infectious disease | Post-acute consequences | See Table 4.2 for complete list of symptoms (Howe et al. 2023) | 0.033 | Various (Howe et al. 2023) |
The duration used for mild/moderate cases was 7 days due to the shorter duration of Omicron infection, which was the dominant variant in Australia in 2022 and 2023 (Menni et al. 2022). The duration parameters for severe and critical cases are based on empirical data on average length of stay from the National Hospital Morbidity Database (NHMD), using the period from 1 July 2021 to 30 June 2022, which were the latest available data from the NHMD at the time of analysis. It was assumed that the same durations would apply for those hospitalised due to COVID‑19 in 2023. Hospitalisations without an ICU admission are used for severe cases, and those with ICU admission for critical cases. Median length of stay for critical cases only includes time spent in ICU – their time spent outside of the ICU is counted under the median length of stay for severe cases.
The duration parameters used for post-acute consequences were based on symptom-level Australia-specific data and varied between 3 and 9 months (Howe et al. 2023).
Data sources
The input data needed to calculate COVID‑19 non-fatal burden estimates should ideally reflect the full coverage of cases, with any under-ascertainment adjusted for with appropriate data, if available. Under-ascertainment for COVID‑19 is becoming a bigger issue as time goes on due to the move from close contact tracing and strict requirements for PCR-based testing, to rapid antigen testing and reliance on self-reporting.
Due to the easing of reporting requirements since 2022, it was deemed that COVID‑19 case numbers would be under-reported in NNDSS data available for 2023. The ABS provisional deaths data were deemed a reliable source of COVID‑19 deaths and were used to assist in estimating overall case numbers to try to account for this under-ascertainment. This is discussed further in the mild/moderate severity section below. For mild/moderate, severe and critical cases, detailed age distributions were derived from NNDSS data supplied for available months in 2023 (that is, January to August 2023).
Asymptomatic cases
An AIHW COVID‑19 report (AIHW 2021b) used figures from a meta-analysis (Byambasuren et al. 2020) to estimate the proportion of asymptomatic COVID‑19 cases. This showed that 17% of cases were truly asymptomatic (for example, excludes pre-symptomatic cases). However, this review was conducted in 2020 and due to the emergence of newer variants and sub-variants, higher vaccination rates and changes in requirements for COVID‑19 testing in 2022 and 2023, it is likely this proportion is no longer suitable and was not used for this Study.
Mild/moderate cases
Under-ascertainment would be highest in the mild/moderate category given the lower severity (and hence likelihood of reporting) and is likely to be higher in 2023 than previous years of the pandemic due to easing of reporting requirements for 2023. Due to challenges with adjusting for under-ascertainment in COVID‑19 reported case numbers with currently available data, and the high quality of deaths data for COVID‑19, case fatality rates were used to estimate the total number of mild and moderate severity cases in 2023.
Case fatality rates (CFR) by sex were calculated based on 2022 reported cases and deaths. Applying the CFR to the total modelled deaths due to COVID in 2023 allowed an estimation of total 2023 cases. The key assumption in this method is that CFRs in 2022 were maintained in 2023 as case ascertainment was assumed to be better in 2022.
Severe and critical cases
Severe and critical cases were estimated from data on people who were admitted to hospital and to ICU, respectively, from the NNDSS (supplied for January to August 2023). Based on modelling for COVID‑19 deaths, it was assumed that monthly changes in hospitalisations and admission to ICU declined gradually to December. The monthly number of hospitalised and ICU cases were added to estimate the total number of severe and critical cases for 2023.
It was assumed that there would be virtually no under-ascertainment among the severe and critical categories as it is unlikely that people who require hospital care would not receive that care in Australia. People admitted would almost certainly have been tested for SARS-CoV-2 if there was any chance they had contracted it. It was also assumed that the number of cases who were admitted to hospital for isolation purposes rather than treatment was minimal.
As there may be people who contracted COVID‑19 in hospital (but did not suffer from severe or critical disease), identification of these cases in the data would be useful for burden estimation when more detailed hospitals data become available. However, it is acknowledged that because these cases cannot be identified, it may result in an overestimate of the burden due to severe COVID‑19 (though an underestimate of mild/moderate cases).
Post-acute consequences
Australian data on those who develop post-acute consequences of COVID‑19 are becoming more available (Darley et al. 2021; Liu et al. 2021). However, there was still no standard definition and set of symptoms for long COVID at the time of analysis and reporting. In the previous Study (ABDS 2022), a simple approach that used only one disability weight despite the range of symptoms that manifest from long COVID, was adopted due to limited Australian data. As part of the ABDS 2023, a sensitivity analysis was performed to explore how different the resulting YLD would be when using the single disability weight (0.219) from the ABDS 2022 and when using a weighted average disability weight (0.033) calculated by the AIHW using the inputs and disability weights from Howe et al. 2023 (Table 4.2a, Table 4.2b).
Firstly, YLD from post-acute consequences of COVID‑19 in 2022 were estimated using individual symptom prevalence, duration and disability weight values from Howe et al. (2023). These YLD estimates were then compared to the YLD estimates using the ABDS 2022 approach. There was a considerable difference between the two. From this, it was concluded that the disability weight from ABDS 2022 potentially overestimated the YLD due to post-acute consequences of COVID‑19. Therefore, for the ABDS 2023, a single, aggregated disability weight was calculated to replace the much higher disability weight used in ABDS 2022. This single, aggregate disability weight was calculated by:
- calculating the point prevalence of individual symptoms by applying the prevalence and duration from Howe et al. 2023 to the number of COVID‑19 survivors for 2022
- these prevalence estimates by individual symptom were multiplied with the corresponding disability weight from Howe et al. 2023 to estimate the YLD by symptom for 2022
- the YLD were added into a total YLD value
- the total YLD was divided by the total prevalence to produce an average weighted disability weight.
For more detail on the sensitivity analyses, see Updated method for the post-acute consequences of COVID‑19.
To estimate YLD due to post-acute consequences in 2023, the weighted average disability weight was applied to the projected number of COVID‑19 survivors in 2023. Due to the differences in disability weights used, the COVID‑19 YLD and DALY estimates from the ABDS 2023 are not comparable to the COVID‑19 estimates from ABDS 2022.
| Symptom | Disability weight |
|---|---|
| Dysosmia | 0.010 |
Dysgeusia | 0.010 |
Fatigue | 0.051a |
Dyspnoea | 0.019 |
Chest pain | 0.011 |
Muscle weakness | 0.004 |
Dizziness | 0.032a |
Muscle/joint pain | 0.023 |
Headache | 0.037 |
Numb/tingling limbs | 0.023 |
Concentration difficulty | 0.069 |
Memory impairment | 0.069 |
Insomnia | 0.030 |
Anxiety | 0.030 |
Depression | 0.145 |
* Disability weight applied is not directly taken from a disability weight in the 2019 GBD, instead estimated by adjusting existing disability weights.
Source: Howe et al. 2023
| Symptom | Disability weight |
|---|---|
Dysosmia | 0.010 |
Headache | 0.037 |
Eye soreness | 0.011 |
Sore throat | 0.006 |
Cognitive difficulty | 0.045 |
Source: Howe et al. 2023
A number of limitations exist in using the method for estimating burden due to post-acute consequences of COVID‑19 in the ABDS 2023. Firstly, there are inconsistencies in the definition of long COVID, including symptomatology and subsequent sequelae following infection (that is, differing definitions would result in varied adjustment factors). The method also assumes that ‘vaccination’ refers to a 2-course schedule based on analyses in late 2021 and early 2022, and that the vaccination profile remains the same for 2023. It is therefore unclear how results may change due to waning immunity over time, although there is uncertainty around how booster doses may moderate this in 2023 (Chemaitelly et al. 2021, Levin et al. 2021). The prevalence estimates of long COVID as a single outcome also do not directly equate to the prevalence of the individual symptoms discussed by Howe et al. (2023) given the possibility of people experiencing more than one symptom. Finally, it was assumed that the prevalence, duration and severity of long COVID from 2022 would apply to the COVID‑19 survivors in 2023 despite the SARS-CoV-2 virus continuing to evolve and adapt. Therefore, there may be more refinements to these methods in future ABDS.
Estimation of lower respiratory infections (including influenza and pneumonia) for 2023
Fatal burden
Deaths due to lower respiratory infections (LRIs), including influenza and pneumonia, were sourced from ABS provisional death registration data for 2023 and the Australian Influenza Surveillance Reports. The Australian Influenza Surveillance Reports are compiled from a number of data sources, including laboratory-confirmed notifications to the NNDSS; sentinel hospital admissions with confirmed influenza; sentinel influenza-like illness (ILI) reporting from general practitioners; ILI-related community level surveys; and sentinel laboratory testing results. See Department of Health and Aged Care (DHAC 2023) for more information.
Deaths for 2023 were first estimated for fatal burden calculations and were derived separately for LRIs and influenza. Provisional doctor-certified deaths by month and age groups from January to June 2023 were provided by the ABS and used as death estimates for the first 6 months of 2023. The number of deaths for June was inflated to account for incomplete registration. For the remainder of 2023, the pattern of monthly doctor-certified deaths in 2019 were used to inform the proportional increase (or decrease) of deaths from one month to the next month. For influenza, monthly deaths from the Australian Influenza Surveillance Reports up to September were compared with the ABS provisional deaths data supplied and validated the trend predicted for July and August.
Using deaths between 2011 and 2019 from the NMD, an average inflation factor from all deaths to doctor-certified deaths for LRIs and influenza was derived. This factor was applied to the number of doctor-certified deaths estimated for 2023 for these causes.
The age distribution from the provisional deaths data provided by the ABS for available months in 2023 was applied to the total number of deaths estimated for LRI and influenza in 2023. The standard reference life table was then applied to the estimates to derive the YLL at each age.
Non-fatal burden
Conceptual models
The following disease model forms the conceptual basis for modelling YLD calculations for lower respiratory infections (LRIs) including pneumonia, including the sequelae, health states and disability weights.
Figure 4.2: Conceptual model for lower respiratory infections

A duration of 2 weeks was used for both health states to estimate point prevalence.
The following disease model forms the conceptual basis for modelling YLD calculations for influenza, including the sequelae, health states and disability weights.
Figure 4.3: Conceptual model for influenza

A duration of 2 weeks was used for both health states to estimate point prevalence.
Data needs and potential sources
For the ABDS 2018, the following data sets were used for estimating burden from LRIs (including pneumonia) and influenza:
- The Bettering the Evaluation and Care of Health (BEACH) program data were used to estimate the total incidence of LRIs (including pneumonia) and influenza, accounting for the moderate severity in each of the above conceptual models. As the BEACH program last published data for 2016, disease rates for that year were applied to the 2018 population. Influenza is notifiable in all states and territories. However, notifications are ‘strongly influenced by the healthcare seeking behaviour of patients, testing, notification practices and follow-up by jurisdictional health departments’ (Li-Kim-Moy et al. 2016). Notifications are likely to be a significant underestimate of influenza incidence.
- The incidence of severe cases of LRIs and influenza were sourced from the National Hospital Morbidity Database (NHMD). The latest data available for the NHMD are for 1 July 2020 to 30 June 2022.
Influenza
For the ABDS 2023, national notifications information published by the Australian Department of Health and Aged Care (DHAC 2023) were used to explore trends in influenza between 2017 and 2023. Based on this, it was assumed that the overall number of influenza cases in the first half of 2023 will be similar to the first half of 2019. There are some limitations with this assumption. Firstly, the degree of under-ascertainment in influenza notifications data in 2017 and 2019 is unknown. The degree of under-ascertainment may also change from year to year depending on factors such as testing rates and severity of disease for that year. Finally, trends in notifications may not necessarily mimic trends in hospitalisation.
With this assumption, severe influenza point prevalence estimates for 2023 were modelled using hospitalisations in the first half of 2019 using the NHMD. Severe influenza for the second half of the year was assumed to be the same as the first half. Moderate influenza point prevalence for 2023 was then modelled using the ratio of moderate point prevalence to severe point prevalence in 2019.
Lower respiratory infections (including pneumonia)
There were no national data on incidence of LRIs for 2023 at the time of analysis. However, it was observed that hospitalisations for LRIs were stable between 2017 and 2019. It was assumed that hospitalisations for 2022 would be similar to the hospitalisation trends between 2017 and 2019 following the reduction in public health measures from COVID‑19, which had resulted in lower hospitalisations due to LRI in 2020 and 2021.
With this assumption, severe LRI point prevalence estimates for 2023 were modelled using patterns in hospitalisations from 2017, 2018 and 2019. Moderate LRI point prevalence for 2023 was then modelled using the ratio of moderate point prevalence to severe point prevalence in 2019.
Comorbidity bias adjustment is an important step in ensuring non-fatal disease burden does not exceed the aggregate possible YLD that can be experienced. The estimates for COVID‑19 and lower respiratory infections (LRIs), including influenza and pneumonia, were therefore each adjusted for comorbidity using the average disability weight change from the comorbidity adjustment for all projected causes in 2020 by sex and age group.
Health-adjusted life expectancy
To calculate health-adjusted life expectancy (HALE), Sullivan’s method was used (see Jagger et al. 2014). Further information can be found in Australian Burden of Disease Study: methods and supplementary material 2018.
For ABDS 2023, the projected 2023 YLD rates by age and sex were used in the calculation of HALE. AIHW calculated its own life table for 2023, derived from the ABS provisional deaths (January to June 2023) by single year of age. The remainder of the year was modelled based on past monthly trends. The age-sex distribution was derived from the ABS provisional deaths data provided. The resulting life table and HALE estimates produced were validated against the Centre for Population’s Australian life tables projections for 2023 produced by the AGA (customised data request).
For other reference years, the 2016–2018 life table (ABS 2019) was used for 2018 HALE estimates, the 2013–2015 life table (ABS 2016) was used for 2015 HALE estimates, the 2010–2012 life table (ABS 2013a) was used for 2011 HALE estimates and the 2002–2004 life table (ABS 2005) was used for 2003 HALE estimates.
Population data
All Australian population-based rates for 2021, 2020, 2019, 2018 were calculated using populations rebased to the 2016 Census (accessed 15 December 2022) (ABS 2022).
Population-based rates for 2015 were calculated using final population estimates from the 2011 Census (accessed 22 December 2018) (ABS 2018).
Population-based rates for 2011 and 2003 were calculated using final population estimates from the 2011 Census (ABS 2017).
Population data for 2023 were sourced from population projections by the Centre for Population (2022). This was the only available source that accounted for the early impacts of the COVID–19 pandemic on Australia’s population. The population under the ‘central scenario’ was used for this Study, which assumed overseas migration to Australia was significantly affected by the COVID–19 pandemic.
The 2001 Australian Standard Population was used for all age-standardisation, as per AIHW and ABS standards (ABS 2013b).
Years of life lost and years lived with disability data quality
To provide information on the quality of estimates, a quality index was developed for the ABDS to rate estimates according to the relevance and quality of source data, and methods used to transform data into a form required for analysis. Generally, the higher the rating, the more relevant and accurate the estimate.
To report on the reliability of projected burden of disease measures, the inclusion of confidence intervals associated with regression estimates was explored. However, these were not presented as these relate to the regression models and do not reflect the underlying uncertainty associated with data inputs that inform prevalence estimates. Other outputs of the regression models may indicate the best fit projection based on the set of years of life lost (YLL) and years lived with disability (YLD) crude rates available for each age-sex-cause group. However, these do not necessarily represent the most appropriate projections in the context of the overall epidemiology of a given disease or injury, especially when considering impacts of the COVID‑19 pandemic.
The burden estimates for ABDS 2023 were largely based on trend analyses. The quality of input estimates in the ABDS 2023 for earlier reference years (2003, 2011, 2015 and 2018) are the same as the quality presented in the ABDS 2018. The ABDS 2018 estimates were produced using the best data available within the scope and time frame of the study.
Fatal burden (YLL) estimates were considered to have the highest quality rating for both data and methods used, as they used administrative data from the National Mortality Database, or the ABS provisional deaths supplied. The projections for 2023 were largely based on previous mortality trends. The non-fatal burden (YLD) estimates varied depending on the disease or injury, and the data sources used.
Information about the quality of the YLD 2018 estimates and the data and methods used can be found in Appendix B in:
- Australian Burden of Disease Study: impact and causes of illness and death in Australia 2018
- Australian Burden of Disease Study: methods and supplementary material 2018.
An assessment of the quality of YLD estimates for COVID‑19 were not available in the ABDS 2018. Lower respiratory infections (including influenza and pneumonia) were adjusted using recent data due to available evidence that these diseases were impacted by COVID‑19. To help users understand the potential sources of uncertainty associated with the estimates, the 2-dimensional index developed for the burden estimates was used for these 2 diseases. This index was derived based on:
- the relevance of the underlying epidemiological data
- the methods used to transform that data into a form required by this analysis.
The index is scored on a scale from A (highest) to E (lowest). The quality of COVID‑19 and lower respiratory infections (including influenza and pneumonia) are discussed below.
COVID‑19
Estimates for COVID‑19 are considered to be of somewhat reasonable quality. Data sources were considered relevant as they were broadly derived from the NNDSS and ABS. The estimates for post-acute consequences of COVID‑19, which is the biggest contributor to non-fatal burden, were calculated using a more detailed approach compared with ABDS 2022 based on Australia-specific data where individual symptomatology proportions and durations were applied to determine point prevalence estimates. Mortality estimates needed to be modelled for the last 5 months of the year, which relied on the assumption that the current decreasing trend in number of cases will continue for the remainder of the year. Therefore, estimates must be used with caution.
Data score = D
Method score = D
Lower respiratory infections (including influenza and pneumonia)
Estimates for lower respiratory infections (LRIs) are considered to be of reasonable quality. Modelling was based on assumptions that LRIs and influenza were similar to years before the COVID‑19 pandemic. These assumptions may not hold once 2023 data are available. Therefore, estimates must be used with caution.
Data score = C
Method score = C