Key findings
Burden of disease measures the impact of diseases and injuries on a population. It combines the years of healthy life lost due to living with ill health (non-fatal burden) with the years of life lost due to dying prematurely (fatal burden). The Australian Burden of Disease Study (ABDS) 2023 includes estimates of disease burden due to 220 diseases and injuries in Australia in 2023.
This report presents findings from the ABDS 2023, with estimates for previous years (2003, 2011, 2015, 2018) for comparison. To explore burden of disease estimates with various disaggregations in more detail refer to the Interactive data visualisations and the downloadable Data tables.
For the latest subnational burden of disease estimates, refer to the ABDS 2018 interactive data visualisations by State and territory, Remoteness areas and Socioeconomic groups. For the latest estimates of disease burden due to risk factors, refer to the ABDS 2018 Interactive data on risk factor burden.
About the ABDS 2023
In the ABDS 2022, for the first time disease burden estimates were projected to the publication year (2022) and included estimates of disease burden due to COVID‑19. The ABDS 2023 builds on that Study by refining methods for estimating burden in the year of analysis (2023). The ABDS 2023 also makes use of more recently available data, such as the National Survey of Mental Health and Wellbeing 2020–21.
Burden from COVID‑19 was estimated using the most recent data available at the time of analysis, with assumptions made about the period without full data. Given the dynamic and ongoing nature of the COVID‑19 pandemic, these estimates may be revised in the future as more data become available for the latter part of 2023.
ABDS 2023 includes a section on the National Preventive Health Strategy 2021–30 burden of disease targets and a new data visualisation on health-adjusted life expectancy (HALE).
For more information on methods used in the Study, refer to the Technical notes.
What is burden of disease?
Burden of disease analysis is a way of measuring the impact of diseases and injuries on a population (in this report, the population of Australia). It is the difference between a population’s actual health and its ideal health, where ideal health is living to old age in good health (without disease or disability).
Burden of disease is measured using the summary metric of disability-adjusted life years (DALY, also known as the total burden). One DALY is one year of healthy life lost to disease and injury. DALY caused by living in poor health (non-fatal burden) are the ‘years lived with disability’ (YLD). DALY caused by premature death (fatal burden) are the ‘years of life lost’ (YLL) and are measured against an ideal life expectancy. DALY allows the impact of premature deaths and living with health impacts from disease or injury to be compared and reported in a consistent manner.
If a disease has a high number of DALY, it is considered to have a high burden on the population. Some diseases have high fatal burden due to the number of premature deaths they cause (for example, cancers) or they cause death at younger ages, while others have high non-fatal burden due to the number of people living with the condition and/or the severity of the illness (for example, musculoskeletal conditions).
Burden estimates can be reported for diseases or injuries, which describe a specific health problem (for example, dementia). Reporting can also be for a disease group (for example, neurological conditions), which consists of a number of related diseases. There are 220 separate diseases and injuries, and 17 disease groups in the ABDS.
Living with illness or injury accounts for just over half the burden
In 2023, Australians lost 5.6 million years of healthy life (total burden, DALY) due to:
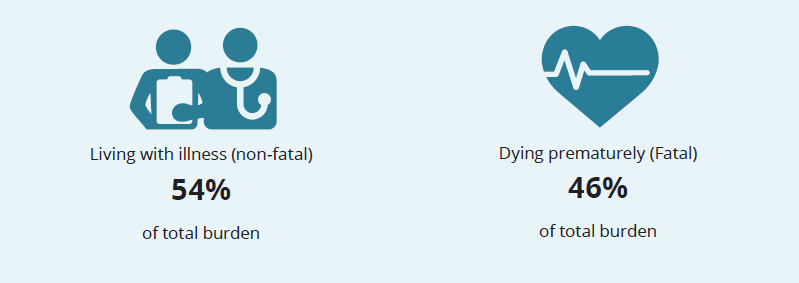
Living with illness or injury caused more disease burden than dying prematurely. Between 2003 and 2023, there has been a moderate shift from fatal burden to non-fatal burden being the biggest contributor to total burden (Figure 2.1). This is mostly driven by fewer premature deaths in recent years.
Figure 2.1: Proportion (%) of total burden due to fatal and non-fatal burden between 2003 and 2023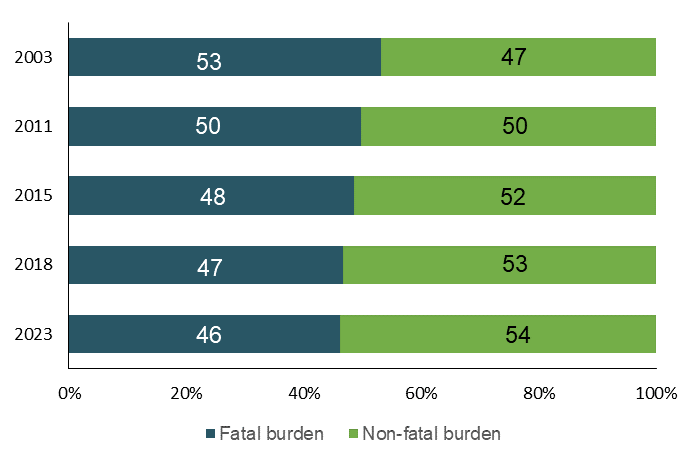
Source: AIHW Australian Burden of Disease Database.
To further explore the contribution of fatal and non-fatal burden over time, refer to the interactive data visualisations: Burden of disease in Australia and Fatal vs. non-fatal burden.
Long-term improvements in fatal burden but recent increases in non-fatal burden
Over the 20-year period from 2003 to 2023, the rate of total disease burden (the crude rate) was relatively similar (212 DALY per 1,000 population in 2003 compared with 213 DALY per 1,000 population in 2023). Underlying this was a 13% decrease in the rate of fatal burden while the rate of non-fatal burden increased by 15% over that period.
After adjusting for population ageing, there was an 11% decline in the age-standardised rate of total burden between 2003 and 2023 (Figure 2.2). This was driven by a 27% decrease in the rate of fatal burden, as the non-fatal burden rate increased by 6.3%.
Note that when compared with 2018, age-standardised rates for 2023 were higher for non-fatal, lower for fatal burden and similar for total burden. Impacts due to the COVID‑19 pandemic may have caused or affected the burden due to other causes, including impacts due to restrictions and lockdowns. Therefore, simply subtracting the disease burden due to COVID‑19 from the total burden does not necessarily reflect the true disease burden experienced had the COVID‑19 pandemic not occurred.
Interpreting crude and age-standardised rates
Crude rates show the actual rate of disease burden in each year, whereas age-standardised rates show the rate of burden if the population age structure did not change over time. Given that Australia’s population is ageing, and the incidence of most chronic diseases increases with age, presenting both crude and age-standardised rates is important to determine whether or not changes in disease burden are largely a result of an ageing population. However, it is important to understand the crude rates to understand the impact on society and on the health system.
To further explore changes over time, refer to the interactive data visualisation: Comparisons over time.
Figure 2.2: Change in the age-standardised total burden (DALY), fatal burden (YLL) and non-fatal burden (YLD) rate (per 1,000 population) between 2003 and 2023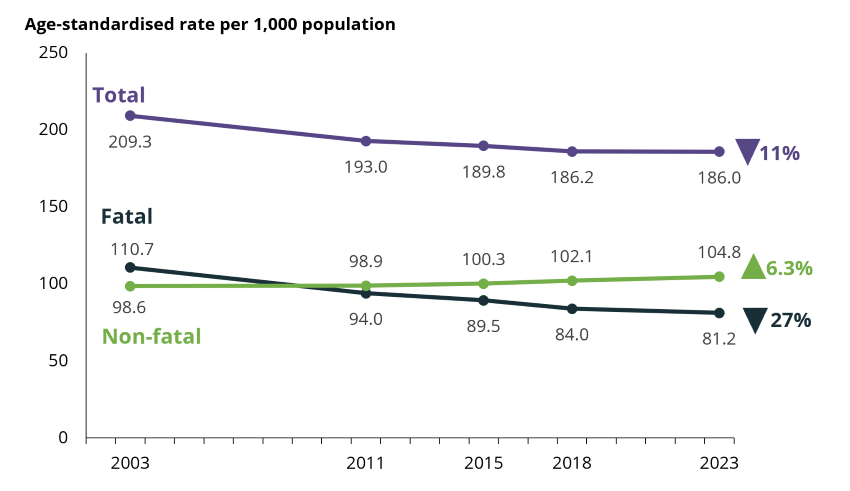
Source: AIHW Australian Burden of Disease Database.
Chronic diseases cause most of the burden
In 2023, the 5 disease groups causing the most burden were cancer, mental health conditions & substance use disorders, musculoskeletal conditions, cardiovascular diseases and neurological conditions (Figure 2.3).
Together these disease groups accounted for around two-thirds (64%) of the total burden. These disease groups include mostly chronic, or long-lasting, conditions.
Cancer as a disease group contributed the most burden across all years of the Study. With the release of the National Survey of Mental Health and Wellbeing 2020–21, burden estimates for depressive disorders, anxiety disorders, bipolar affective disorder and alcohol use disorder were updated for all reference years since the previous ABDS. This, together with improvements to the main data source used to estimate autism spectrum disorders, help us better understand the change in burden due to mental health conditions over time. In 2023, mental health conditions & substance use disorders increased in rank to second place, which was different to the previous ABDS. For more detail on these changes, refer to the Technical notes.
The contribution of fatal and non-fatal burden to the total burden varies by disease and injury. To explore the contribution of fatal and non-fatal burden to total burden by disease group or by specific disease or injury, refer to the interactive data visualisation: Fatal vs non-fatal burden.
Figure 2.3: Proportion (%) of total burden, and fatal and non-fatal composition of total burden, for the leading 5 disease groups in 2023
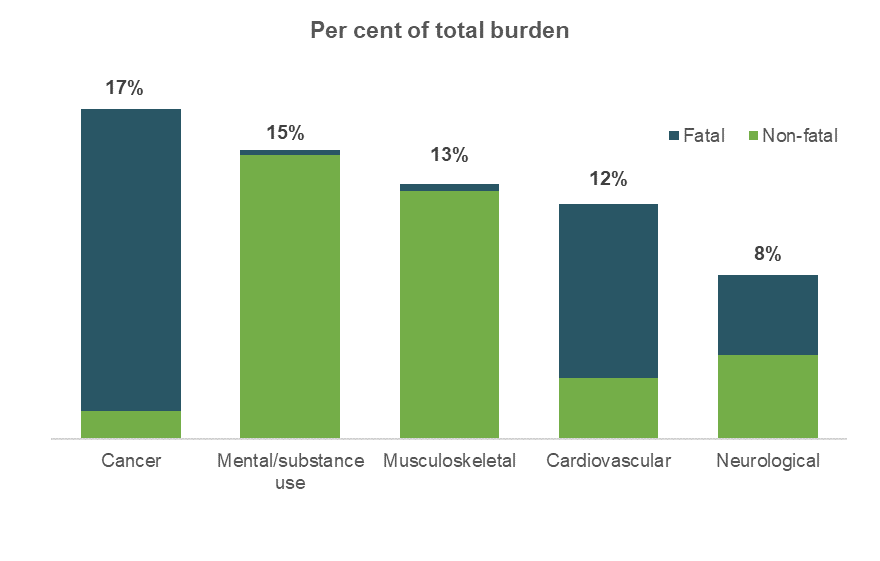
Source: AIHW Australian Burden of Disease Database.
Coronary heart disease is the leading specific cause of burden
When considering individual diseases, coronary heart disease was the leading cause of burden for every reference year in the Study. However, the burden from coronary heart disease showed the largest absolute reduction over time and was mainly driven by large declines in fatal burden.
The leading 5 diseases that caused burden (% of total DALY) in 2023:
- coronary heart disease (5.4%)
- dementia (4.4%)
- back pain & problems (4.3%)
- anxiety disorders (3.9%)
- chronic obstructive pulmonary disease (COPD) (3.6%).
To explore burden for individual diseases and changes in disease burden over time, refer to the interactive data visualisation: Disease/ injury-specific summary.
COVID‑19 burden in 2023
COVID‑19 is a disease caused by severe acute respiratory syndrome coronavirus 2 (SARS-CoV-2). It is a highly infectious disease and has a wide spectrum of severity.
The total burden from COVID‑19 was 48,400 DALY (1.8 DALY per 1,000 population) in 2023. Consequently, 0.9% of all health loss was estimated as being due to the direct effects of COVID‑19. It ranked 30th among the specific diseases in 2023. The burden from COVID‑19 was predominantly fatal (83%) and was higher in males. The burden was highest in those aged 75–84 years.
Post-COVID‑19 condition (also known as ‘long COVID’) contributed around half (50%) of the non-fatal COVID‑19 burden or around 9% of the total burden due to COVID‑19.
COVID‑19 was the 18th leading cause of fatal burden (contributing 1.5%) and 49th leading cause of non-fatal burden (contributing 0.3% in 2023).
Note on COVID‑19 burden in 2023
Estimates of the disease burden due to COVID‑19 in 2023 were based on information and data available at the time of analysis. This included data on deaths, cases and hospitalisations up until August 2023. Assumptions were made on the number and severity of COVID‑19 cases, the number of cases who developed long COVID and the number of cases and deaths due to COVID‑19 in the latter half of 2023 (including that there are no notable changes due to a new variant).
Additionally, estimates of burden due to COVID‑19 were considerably lower in 2023 than what was estimated for 2022 in the previous study. However, the estimates are not strictly comparable due to changes in the data sources and methods used. For more information on how disease burden due to COVID‑19 was estimated, refer to the Technical notes.
Given the dynamic and ongoing nature of the pandemic, estimates presented here may be updated in the future when more data for each component (including data on burden due to permanent functional impairment – see Technical notes) of the COVID‑19 model become available, and more is learnt about the disease and its impact on the population.
Males and females experience disease burden differently
Overall and for most age groups, males experienced more total burden than females. This was driven by males having higher rates of fatal burden.
In 2023, males experienced 1.1 times the rate of total burden and 1.4 times the rate of fatal burden of females (223 and 202 DALY per 1,000 population and 116 and 81 YLL per 1,000 population, respectively), however, females experienced 1.1 times the rate of non-fatal burden of males (121 and 108 YLD per 1,000 population, respectively). After adjusting for different age structures, males experienced 1.2 times the rate of total burden and 1.6 times the rate of fatal burden of females while females experienced 1.1 times the rate of non-fatal burden of males.
Males experienced 1.3 times the rate of total burden due to cancer experienced by females (40 DALY and 31 DALY per 1,000 population, respectively). Males also experienced over 2 times the rate of total burden due to injuries (24 and 11 DALY per 1,000 population, respectively) and 1.5 times the rate of total burden due to cardiovascular diseases (30 and 20 DALY per 1,000 population, respectively) experienced by females. Females experienced 1.3 times the total burden due to musculoskeletal and neurological conditions (31 and 20 DALY per 1,000 population, respectively) experienced by males (24 and 15 DALY per 1,000 population respectively).
In 2023, the leading specific causes of total burden among males were coronary heart disease, back pain & problems and suicide & self-inflicted injuries. Among females, the leading specific cause was dementia, followed by anxiety disorders and back pain & problems.
Males experienced 3 times the amount of burden due to suicide & self-inflicted injuries and 2 times the amount of burden from coronary heart disease than females. Females experienced more burden than males from dementia, anxiety disorders and osteoarthritis.
Diseases that caused the most burden over the life course
Australians experience health loss from different diseases and injuries at various stages of life. Respiratory diseases caused burden throughout the life course, especially in children and the elderly. Mental health conditions & substance use disorders dominated the first half of the life course, while musculoskeletal conditions, cardiovascular diseases and cancer feature more prominently in the latter part of the life course. Neurological conditions (namely dementia) are a leading cause of burden in older Australians (age 65 and over).
Leading causes of burden over the life course can be different for females and males (Figure 2.4).
Infants and children aged under 5
Infant & congenital conditions as a group caused the most burden. Pre-term & low birthweight (lbw) complications, birth trauma & asphyxia, cardiovascular defects, sudden infant death syndrome (SIDS) and asthma were the leading 5 specific causes of burden.
Children aged 5–14
Mental health conditions and respiratory diseases contributed the most burden.
Among girls, asthma was the leading specific cause of burden, followed by anxiety disorders. Among boys, autism spectrum disorders was the leading specific cause of burden followed by asthma. Depressive disorders and conduct disorder were also among the 5 leading causes of burden.
People aged 15–24
Mental health conditions & substance use disorders, and injuries contributed the most burden.
Anxiety disorders was the leading specific cause of burden in females. Suicide & self-inflicted injuries was the leading specific cause of burden in males.
Suicide & self-inflicted injuries and autism spectrum disorders were among the leading 5 causes of burden in males but not females. Eating disorders and bipolar affective disorder were among the leading 5 causes of burden in females but not males.
People aged 25–44
Mental health conditions & substance use disorders, musculoskeletal conditions and injuries contributed the most burden.
Anxiety disorders, back pain & problems and depressive disorders were among the leading 5 specific causes of burden for both men and women in this age group. Suicide & self-inflicted injuries and poisoning were in the top 5 causes of burden for men, whereas asthma and eating disorders were among the top 5 causes for women.
People aged 45–64
Musculoskeletal conditions caused the most burden among this age group.
Back pain & problems was the leading specific cause of burden in women and coronary heart disease was the leading specific cause of burden in men.
For women, osteoarthritis, breast cancer, anxiety disorders and rheumatoid arthritis were among the leading 5 specific causes of burden. For men, back pain & problems, suicide & self-inflicted injuries, lung cancer and chronic liver disease were among the leading 5 specific causes of burden.
People aged 65–84
Coronary heart disease, dementia, COPD and lung cancer were all among the leading specific causes of burden in men and women. Osteoarthritis was among the 5 leading causes of burden for women while type 2 diabetes mellitus was among the 5 leading causes for men.
People aged 85 and over
Dementia was the leading cause of burden in both men and women followed by coronary heart disease, COPD and stroke. Falls was among the 5 leading causes of burden for women while prostate cancer was among the 5 leading causes for men.
Figure 2.4: Leading causes of total burden (DALY ‘000; proportion %), by sex and age group, 2023
Source: AIHW Australian Burden of Disease Database.
For more information on the leading causes of total, fatal and non-fatal burden in Australia by sex and age and to explore how this has changed over time, refer to the interactive data visualisation: Leading causes of disease burden.
Changes in leading specific causes of disease burden over time
Over time, the leading individual causes of disease burden in Australia have changed (Figure 2.5). Between 2003 and 2023, the crude rate of total burden:
- decreased for coronary heart disease, stroke, lung, bowel and breast cancer and rheumatoid arthritis
- substantially increased for dementia, and its rank increased from the 12th leading cause of total burden in 2003 to the 2nd leading cause in 2023. However, this increase is partly due to changes in practices of coding deaths due to dementia (refer to Comparisons over time and Technical notes)
- increased for back pain & problems, anxiety disorders, COPD, depressive disorders, osteoarthritis, asthma and type 2 diabetes.
Coronary heart disease and stroke were the leading causes of fatal burden in 2003, however, premature deaths from these causes have decreased over time. Back pain & problems was the leading cause of non-fatal burden in 2023.
Age-standardised rates show the rate of burden if the population age structure did not change over time, which can indicate whether changes in disease burden are largely a result of an ageing population. This is important, as the rate of many of the leading causes of disease burden in Australia increase with age.
There were differences in the leading causes of total burden and therefore their ranking when looking at age-standardised burden rates compared with crude burden rates. The rankings of age-related conditions (such as dementia, COPD, some cancers and osteoarthritis) were often lower in more recent years when ranking by age-standardised rates compared with crude rates. This indicates that an ageing population is one of the factors that influence changes to Australia’s leading causes of disease burden. Other factors include (but are not limited to) population growth and changes in the amount of disease or injury. For more information on the drivers of change in disease burden over time refer to the ABDS 2018 Interactive data on disease burden.
To explore changes in the leading causes of disease burden over time (by number and age-standardised rate) for 2023 compared with each of the previous years (2003, 2011, 2015 and 2018) refer to the interactive data visualisation: Leading causes of disease burden.
Figure 2.5: Change in disease ranking by total burden (DALY per 1,000 population), 2003 and 2023.
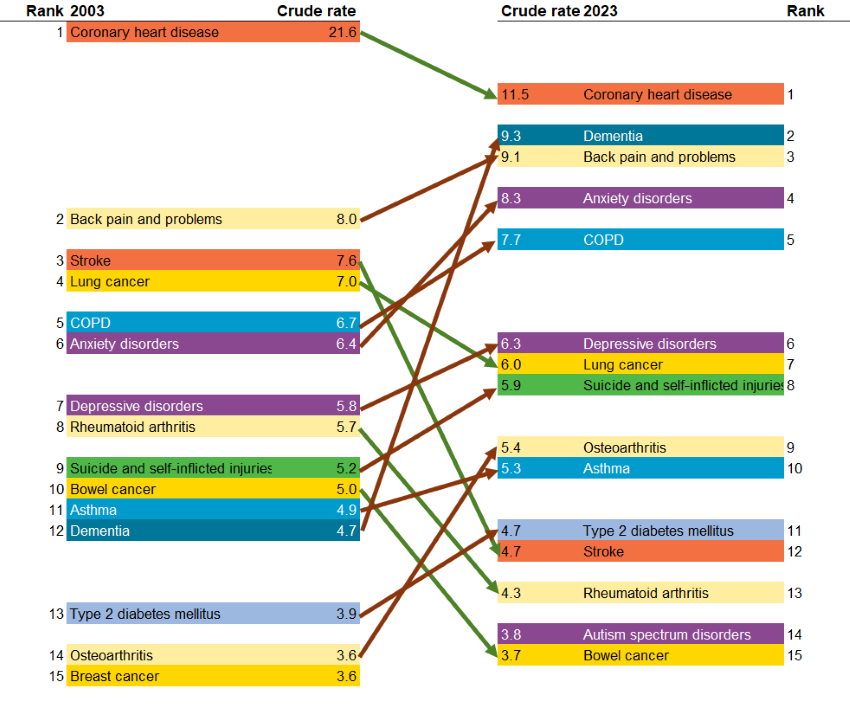
Notes:
- Diseases are presented in descending order, from highest to lowest DALY per 1,000 population, with arrows indicating either an increase (orange) or decrease (green) in total burden crude rate over time.
- ‘Other musculoskeletal conditions’ are excluded from the rankings.
- There were changes in practices of coding deaths due to dementia, therefore, caution is recommended when interpreting changes over time for dementia burden.
- Since the ABDS 2018, the Intellectual Disability Exploring Answers (IDEA) data has been linked to the National Disability Insurance Scheme (NDIS), resulting in higher ascertainment of individuals with autism spectrum disorders. Estimates for 2018 were revised to allow comparisons with 2023 estimates, however, estimates for 2023 are not comparable to estimates for 2015 and earlier due to the addition of a new ascertainment source to the IDEA.
Source: AIHW Australian Burden of Disease Database.
Australians living longer but little change in the proportion of life spent in full health
Australians are, on average, living longer and spending more years in full health (meaning no disease or injury). Years lived in full health is also referred to as the health-adjusted life expectancy (HALE). However, years lived in ill health are also increasing, resulting in little change in the proportion of life spent in full health.
Interpreting changes in HALE over time
Whether or not the amount of ill health experienced by older Australians has increased has been the subject of ongoing debate. Assessment of how the relationship between life expectancy and HALE has changed over time (by analysing the ratio and difference between the 2 measures) provides an opportunity to examine which of the scenarios of healthy ageing – compression or expansion of morbidity, or equilibrium – provides the best insight into whether longer lives are healthier lives. These 3 health scenarios are described as follows:
Compression of morbidity
In this scenario, increasing life expectancy is accompanied by better health. As the population ages, there is also a delay in the age of onset of disease. As such, we can expect a reduction in the proportion of life spent in ill health (Fries 1980) as most morbidity occurs at the end of life.
Expansion of morbidity
In this scenario, increasing life expectancy is accompanied by more illness and injury before death. As chronically ill people survive for longer, we can expect an increase in the proportion of their lives spent with illness (Gruenberg 1977).
Dynamic equilibrium
In this scenario, the proportion of the lifetime spent living with illness remains relatively constant over time. As life expectancy increases, so does the onset and progression of disease. However, as diseases become more prevalent, they may also be less severe (Howse 2006). If the ratio of HALE to total life expectancy is constant, there is an equilibrium.
Findings from HALE analysis suggest a scenario of equilibrium between 2003 and 2023.
Males and females born in 2023 could expect to live an average of 88% and 87% of their lives in full health respectively (71.6 years of the 81.3 years of average life expectancy for males and 73.6 years of the 85.1 years of average life expectancy for females).
Between 2003 and 2023, the average proportion of life spent in full health changed little for both males (from 89% to 88%) and females (from 88% to 87%). Over this period, males gained 3.2 years in life expectancy and 2.2 years in HALE (Figure 2.6). The corresponding gains for females were 2.1 years in life expectancy and 0.8 years in HALE. Despite these gains in life expectancy and healthy years (which were greater for males than females), the average time spent in ill health increased by 1.0 years for males and 1.3 years for females.
These changes are illustrated in Figure 2.6, showing the split in life expectancy that is average number of healthy years (HALE) and average years in ill health. The results suggest that, at the national level, gains in healthy years at birth are largely comparable with gains in life expectancy at birth. It suggests an equilibrium of morbidity in Australia over this period.
Figure 2.6: Life expectancy at birth as years lived in full health (HALE) and years lived in ill health, by sex, between 2003 and 2023
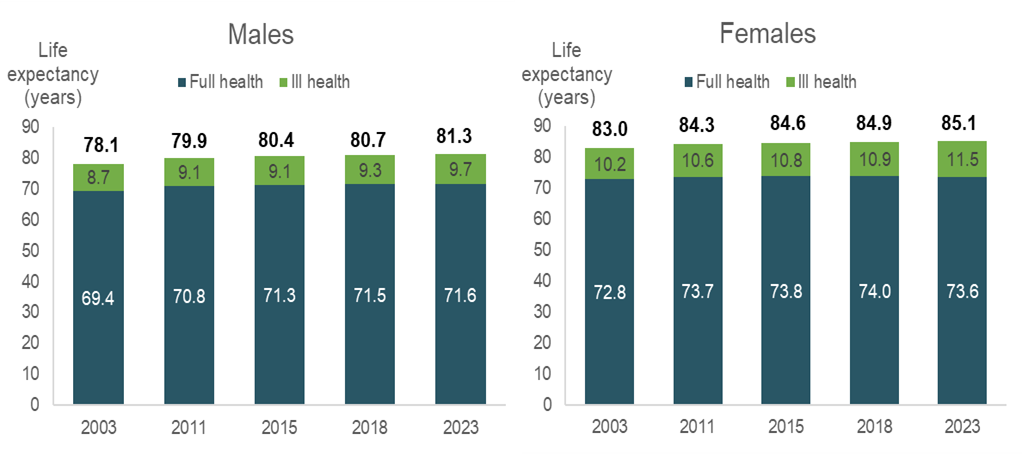
Note: For more information on HALE and the life expectancies used, refer to Technical notes.
Source: ABS provisional mortality 2023 customised data, AIHW Australian Burden of Disease Database.
Changes over time in HALE and life expectancy at age 65 followed a similar pattern as at birth. Life expectancy and HALE at age 65 increased between 2003 and 2023 by 2.5 and 1.9 years, respectively, for males and by 1.5 and 1.0 years, respectively, for females.
For more detailed data on the proportion of life spent in full health by age and how this has changed over time, refer to the interactive data visualisation: Health-adjusted life expectancy.
National Preventive Health Strategy 2021–30: burden of disease targets
The National Preventive Health Strategy 2021–30 (the ‘Strategy’) outlines the long-term approach to prevention in Australia. The Strategy aims to address the wider determinants of health, promote health equity and decrease the overall burden of disease through a whole-of-systems approach to prevention (Department of Health 2021).
To assess progress over the 10-year period, the Strategy outlines several targets to achieve by the year 2030. There are 6 burden of disease specific targets in the Strategy and data from the Australian Burden of Disease Study 2023 can be used to monitor 3 of the 6 targets:
- the proportion of the first 25 years lived in full health will increase by at least 2 percentage points by 2030
- the proportion of the first 0–4 years of life lived in full health will increase by at least 3.5 percentage points by 2030
- Australians have at least an additional 2 years of life lived in full health by 2030.
Estimates for the remaining 3 indicators involve analysis at subnational level, which was not in the scope of the current report (however, these will be reported in the next major ABDS study and First Nations study). These targets are:
- Australians in the 2 lowest socioeconomic groups will have at least an additional 3 years of life lived in full health by 2030
- Australians in regional and remote areas will have at least an additional 3 years of life lived in full health by 2030
- Aboriginal and Torres Strait Islander (First Nations) people will have at least an additional 3 years of life lived in full health by 2030.
For estimates of burden of disease by population group, refer to the Australian Burden of Disease Study: impact and causes of illness and death in Australia 2018 and the Australian Burden of Disease Study: impact and causes of illness and death in Aboriginal and Torres Strait Islander people 2018.
Australia’s current performance against the targets
Table 2.1 shows how the burden of disease measures in 2023 compare with the baseline measures (the year 2018) for each reportable target. Between 2018 and 2023, there has been little change in the proportion of the first 25 years and 0–4 years lived in full health (ranging between 91 and 92%). There has also been little change in the average number of years lived in full health (approximately 72 years for males and 74 years for females).
Aim | Target | Sex | 2018 (baseline) | 2023 estimate | Comparison to 2018 |
|---|---|---|---|---|---|
All Australians have the best start in life | The proportion of the first 25 years lived in full health will increase by at least 2 percentage points by 2030 | Persons | 92.1% of first 25 years were lived in full health | 91.6% of first 25 years were lived in full health | –0.5(a) |
All Australians have the best start in life | The proportion of the first 0‑4 years of life lived in full health will increase by at least 3.5 percentage points by 2030 | Persons | 92.0% of first 5 years were lived in full health | 91.4% of first 5 years were lived in full health | –0.6(a) |
All Australians live in good health and wellbeing for as long as possible | Australians have at least an additional 2 years of life lived in full health by 2030 | Males Females | 71.5 years lived in full health 74.0 years lived in full health | 71.6 years lived in full health 73.6 years lived in full health | 0.1 years -0.4 years |
(a) This is the difference in the proportion of the first 25 or 5 years lived in full health between 2023 and the baseline (2018).
Source: AIHW Australian Burden of Disease Database.
Estimates for 2023 are projections so progress against the targets may change as 2023 data becomes available. COVID‑19’s impacts on burden and the health of the Australian population may affect progress against these targets.
Where do I go for more information?
ABDS 2018 – interactive data visualisations
For more information on the burden of disease in Australia, see the following interactive data visualisations from ABDS 2018:
- State and territory estimates
- Remoteness areas
- Socioeconomic groups
- Risk factor burden
- Disease burden among Aboriginal and Torres Strait Islander people
- Risk factor burden among Aboriginal and Torres Strait Islander people.