Avoidable fatal burden in Australia
In 2018, over half (55%) of the total fatal burden in Australia was classified as avoidable (Table 2). Nearly two-thirds (64%) of fatal burden among First Nations people was avoidable compared with just over half (54%) among non-Indigenous Australians (Table 2, Figure 1).
| First Nations deaths | First Nations YLL | Non-Indigenous deaths | Non-Indigenous YLL | Total deaths | Total YLL | |
|---|---|---|---|---|---|---|
| ABDS 19 part-avoidable causes | 245 | 7,838 | 3,445 | 94,977 | 3,691 | 102,815 |
| ABDS 45 all avoidable causes | 1,453 | 59,776 | 22,753 | 717,159 | 24,205 | 776,935 |
| ABDS all 64 Avoidable deaths causes | 1,698 | 67,614 | 26,198 | 812,136 | 27,896 | 879,751 |
| ABDS total – all causes (<75 only) | 2,827 | 106,241 | 51,764 | 1,497,278 | 54,591 | 1,603,519 |
| % Avoidable (<75 only) | 60.1 | 63.6 | 50.6 | 54.2 | 51.1 | 54.9 |
Note: Numbers may not add to totals due to rounding.
Figure 1: Proportion of deaths and fatal burden classified as avoidable, by Indigenous status, 2018
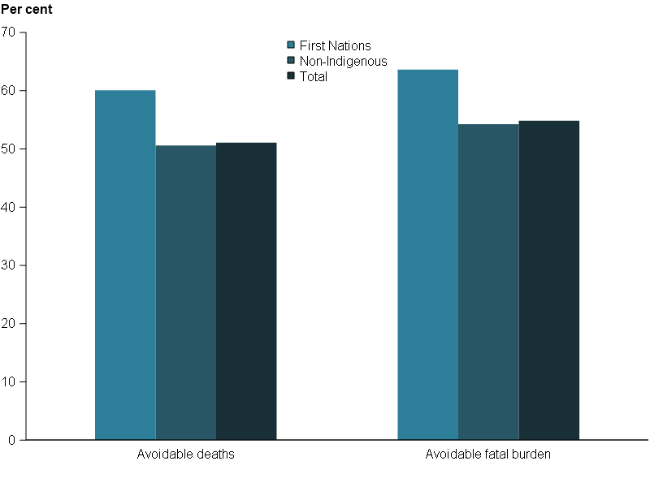
Chart: AIHW. Source: AIHW analysis of Australian Burden of Disease database.
Which diseases and injuries caused the most avoidable fatal burden?
Coronary heart disease, suicide & self-inflicted injuries, and poisoning were the top 3 causes of avoidable fatal burden for both First Nations people and non-Indigenous Australians in 2018. Together these 3 causes accounted for 41% of avoidable fatal burden among First Nations people and 39% among non-Indigenous Australians (Table 3).
Among First Nations people, chronic obstructive pulmonary disease (COPD) and chronic kidney disease were also among the top 5 causes, whereas, for non-Indigenous Australians, bowel cancer and breast cancer rounded out the top 5. For both First Nations people and non-Indigenous Australians, the top 5 causes accounted for over half (52%) of the total avoidable fatal burden.
| Rank | First Nations people | AYLL | % of total | Non-Indigenous Australians | AYLL | % of total |
|---|---|---|---|---|---|---|
| 1 | Coronary heart disease | 11,573 | 17.1 | Coronary heart disease | 126,647 | 15.6 |
| 2 | Suicide & self-inflicted injuries | 10,864 | 16.1 | Suicide & self-inflicted injuries | 124,065 | 15.3 |
| 3 | Poisoning | 5,073 | 7.5 | Poisoning | 63,022 | 7.8 |
| 4 | COPD | 3,983 | 5.9 | Bowel cancer | 62,162 | 7.7 |
| 5 | Chronic kidney disease(a) | 3,880 | 5.7 | Breast cancer(a) | 49,079 | 6.0 |
| 6 | RTI-motor vehicle occupants | 3,390 | 5.0 | COPD | 46,933 | 5.8 |
| 7 | Pre-term birth & LBW complications | 2,938 | 4.3 | Stroke | 45,946 | 5.7 |
| 8 | Type 2 diabetes | 2,658 | 3.9 | RTI-motor vehicle occupants | 30,641 | 3.8 |
| 9 | Stroke | 2,258 | 3.3 | Type 2 diabetes | 20,863 | 2.6 |
| 10 | Homicide & violence | 2,081 | 3.1 | Melanoma of the skin | 18,388 | 2.3 |
| 11 | Other disorders of infancy | 1,814 | 2.7 | Prostate cancer | 17,585 | 2.2 |
| 12 | Other unintentional injuries | 1,512 | 2.2 | Pre-term birth & LBW complications | 16,242 | 2.0 |
| 13 | Birth trauma & asphyxia | 1,505 | 2.2 | Chronic kidney disease | 13,826 | 1.7 |
| 14 | Bowel cancer | 1,484 | 2.2 | Other unintentional injuries | 13,449 | 1.7 |
| 15 | LRI including influenza & pneumonia(a) | 1,478 | 2.2 | Falls | 13,326 | 1.6 |
| 16 | Breast cancer(a) | 1,136 | 1.7 | Birth trauma & asphyxia | 12,336 | 1.5 |
| 17 | RTI-pedestrians | 1,088 | 1.6 | LRI including influenza & pneumonia(a) | 11,515 | 1.4 |
| 18 | Rheumatic heart disease | 1,023 | 1.5 | Kidney cancer | 11,406 | 1.4 |
| 19 | Asthma | 789 | 1.2 | Other disorders of infancy | 11,063 | 1.4 |
| 20 | Falls | 665 | 1.0 | Homicide & violence | 10,404 | 1.3 |
Leading 20 diseases | 61,192 | 90.5 | Leading 20 diseases | 718,897 | 88.5 | |
Remaining 44 causes | 6,422 | 9.5 | Remaining 44 causes | 93,239 | 11.5 | |
Total | 67,614 | 100.0 | Total | 812,136 | 100.0 |
COPD chronic obstructive pulmonary disease; LBW low birthweight; LRI lower respiratory infections; RTI road traffic injuries.
(a) These causes are not directly equivalent to ABDS causes of the same name as only some of the ICD-10 codes included in the ABDS definitions are classified as avoidable deaths. See Table A3 for more detail.
How did avoidable fatal burden compare for First Nations males and females?
First Nations males experienced more avoidable fatal burden than First Nations females overall and for each age group (Figure 2). First Nations males accounted for 61% of the total AYLL compared with 39% for females (40,970 and 26,644 AYLL, respectively).
Compared with First Nations females, First Nations males experienced higher rates of avoidable fatal burden across the life course. Both sexes experienced similarly high rates of avoidable fatal burden in children under 5 and low rates in children aged 5–14. From age 15, as age increased the rate of avoidable fatal burden also rose for both First Nations males and females.
Figure 2: Number and rates of avoidable fatal burden (AYLL and AYLL per 1,000 people) for First Nations people, by age group and sex, 2018
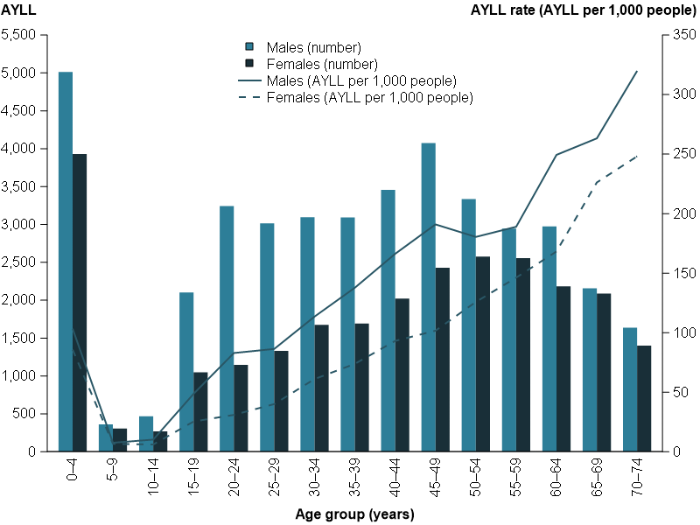
Chart: AIHW. Source: AIHW analysis of Australian Burden of Disease database.
The total avoidable fatal burden, and the specific causes of avoidable fatal burden, that First Nations people experienced in 2018 differed by age and sex. The avoidable fatal burden in 5 broad age groups is described in this section, drawing on results shown in figures 3 and 4. In all 5 age groups, First Nations males experienced more of the burden than First Nations females, with the largest difference among those aged 15–34 where First Nations males accounted for 69% of the avoidable fatal burden (Figure 3).
Figure 3: Proportion of avoidable fatal burden by broad age group and sex, First Nations people, 2018
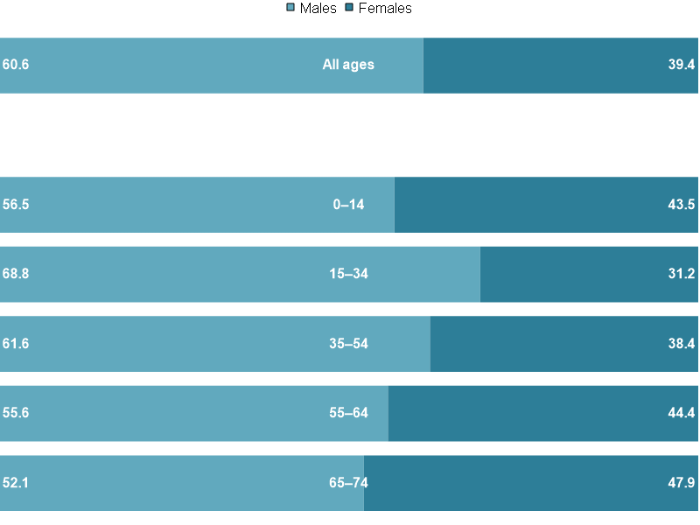
Chart: AIHW. Source: AIHW analysis of Australian Burden of Disease database.
Leading causes of avoidable fatal burden differed across the life course for First Nations males and females (Figure 4). Note that for some diseases, the number of First Nations deaths is small; an asterisk (*) indicates AYLL values where fewer than 5 deaths contributed to the calculation.
Most of the avoidable fatal burden among First Nations children aged 0–14 was from 3 infant & congenital conditions: pre-term birth & low birth weight complications; birth trauma & asphyxia; and other disorders of infancy. These 3 causes accounted for 58% of the avoidable fatal burden for First Nations males and 63% for females in this age group.
Among First Nations males and females aged 15–34, 4 of the top 5 causes of avoidable fatal burden were injuries: suicide & self-inflicted injuries; road traffic injuries (motor vehicle occupants); poisoning; and homicide & violence. Although the same 4 causes were among the top 5 for both sexes, First Nations males accounted for the majority of the AYLL for each cause (between 62% and 74%).
Chronic diseases began to feature as important causes of avoidable fatal burden for First Nations people aged 35–54, with coronary heart disease the leading cause for both First Nations males and females. Suicide & self-inflicted injuries and poisoning were the second and third leading causes for First Nations males, whereas poisoning and chronic kidney disease rounded out the top 3 for First Nations females.
Injuries no longer appeared among the top 5 contributors to avoidable fatal burden from age 55 onwards, with chronic diseases now dominating. Coronary heart disease and COPD were the top 2 causes of avoidable fatal burden for both First Nations males and females, with chronic kidney disease and type 2 diabetes rounding out the top 4 for both sexes.
Figure 4: Top 5 causes of avoidable fatal burden (AYLL) among First Nations people by sex and broad age group, 2018
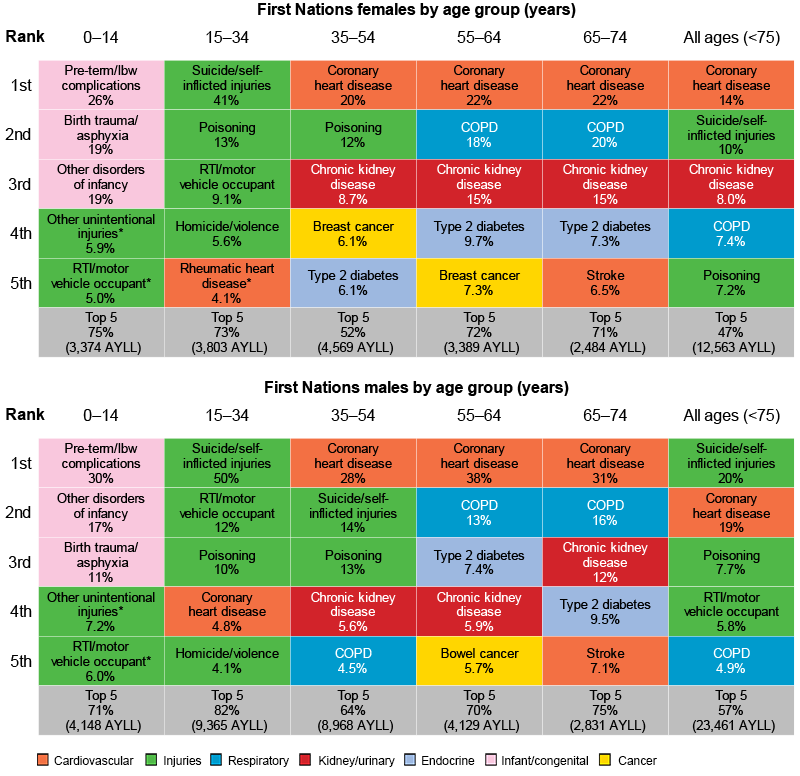
* Number of First Nations deaths used in AYLL calculations is fewer than 5. Small numbers of deaths can affect the reliability of estimates, these results should be used with caution.
lbw low birthweight; RTI road traffic injuries, COPD chronic obstructive pulmonary disease.
Note on colours: As done for other ABDS reporting, conditions that have a similar aetiology, outcomes or treatment are grouped together – into 17 disease groups, 7 of which appear in Figure 4. For ease of recognition in ABDS published results, each disease group was allocated a colour – these are used consistently and allow for quick insight into the disease groups that dominate avoidable fatal burden.
Chart: AIHW. Source: AIHW analysis of Australian Burden of Disease database.
The top 10 causes were responsible for over three quarters (76%) of avoidable fatal burden for First Nations males and around two-thirds (68%) for First Nations females (Figure 5).
Coronary heart disease, suicide & self-inflicted injuries, poisoning and COPD were in the top 5 for both sexes; however, the proportion of avoidable fatal burden that each contributed was different. For First Nations males, road traffic injuries (motor vehicle occupants) also ranked in the top 5 (fourth for males, ninth for females), while for First Nations females, chronic kidney disease ranked in the top 5 (third for females, seventh for males).
Figure 5: Percentage contribution (%) of the top 10 causes of avoidable fatal burden (AYLL) in First Nations females and males, 2018
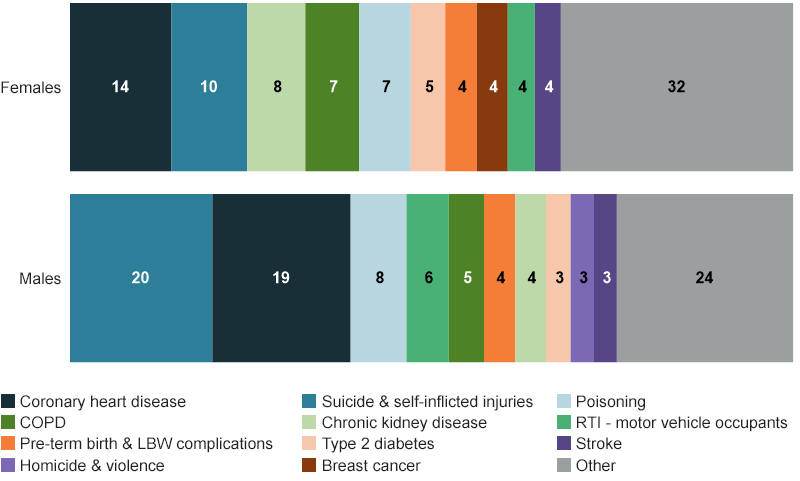
Note: Homicide & violence ranked 13th for First Nations females (2.8% of AYLL), breast cancer did not contribute any AYLL for First Nations males.
Chart: AIHW. Source: AIHW analysis of Australian Burden of Disease database.
Interactive data on avoidable fatal burden among First Nations people
The interactive data visualisations (Figure 6) present estimates of avoidable fatal burden (AYLL) among First Nations people in 2018. Use the interactive graphs to explore the avoidable fatal burden for the top 20 causes by sex and broad age group.
Figure 6: Leading causes of avoidable fatal burden, by age group and sex, First Nations people, 2018
2 interactive visualisations show avoidable fatal burden by selectable age group.
