Technical notes
Data from the National Mortality Database (NMD) were used to derive the avoidable fatal burden component for each of the 19 part-avoidable causes. Deaths were grouped into the 19 causes based on ICD-10 codes and ‘avoidable percentages’ were calculated. For each cause, avoidable percentages were based on the number of deaths occurring before age 75 which were classified as avoidable, divided by the total number of deaths before age 75 for that cause (see Table A4 for selected examples). Separate avoidable percentages were calculated for First Nations people and total Australians.
Avoidable percentages were applied to the fatal burden before age 75 from the 2018 ABDS to determine the avoidable fatal burden (AYLL) for each of the 19 part-avoidable causes.
| Cause | First Nations deaths | First Nations avoidable deaths | First Nations avoidable percent (%) | All deaths | Avoidable deaths | Avoidable percent (%) |
|---|---|---|---|---|---|---|
| LRI including influenza & pneumonia | 53 | 39 | 73.6 | 645 | 448 | 69.5 |
| Non-rheumatic valvular disease | 14 | 9 | 64.3 | 281 | 197 | 70.1 |
| Other cardiovascular diseases | 32 | 8 | 25.0 | 791 | 182 | 23.0 |
| Chronic kidney disease | 136 | 132 | 97.1 | 793 | 713 | 89.9 |
LRI lower respiratory infections
Notes:
- These causes are not directly equivalent to ABDS causes of the same name as only some of the ICD-10 codes included in the ABDS definitions are classified as avoidable deaths.
- The number of deaths in the ABDS database for each cause are slightly different from the number of deaths in the NMD (for the same causes) due to redistribution modelling in the ABDS.
Can I compare results with other ABDS studies?
Results from this study should not be compared with results for fatal burden (YLL) from other Australian Burden of Disease Studies (ABDS). Generally, overarching methods for estimating fatal burden remain unchanged from previous ABDS studies, however, some minor changes to methodology were required to facilitate the analysis by the smaller geographical areas of Indigenous Regions (IREGs). These changes may result in different results to those presented in other ABDS studies.
Indigenous Regions
Indigenous Regions (IREGs) are large geographic areas that are part of the Australian Statistical Geography Standard (ASGS) (ABS 2016). They were originally designed based on the former Aboriginal and Torres Strait Islander Commission boundaries which are no longer maintained. IREGs are created by combining one or more Indigenous Areas and do not cross state or territory borders (Figure A1). For the 2016 ASGS 58 Indigenous Regions are defined to cover the whole of geographic Australia, including several non-spatial special purpose codes (ABS 2016).
Figure A1: First Nations population (aged under 75) by Indigenous Region, 2018
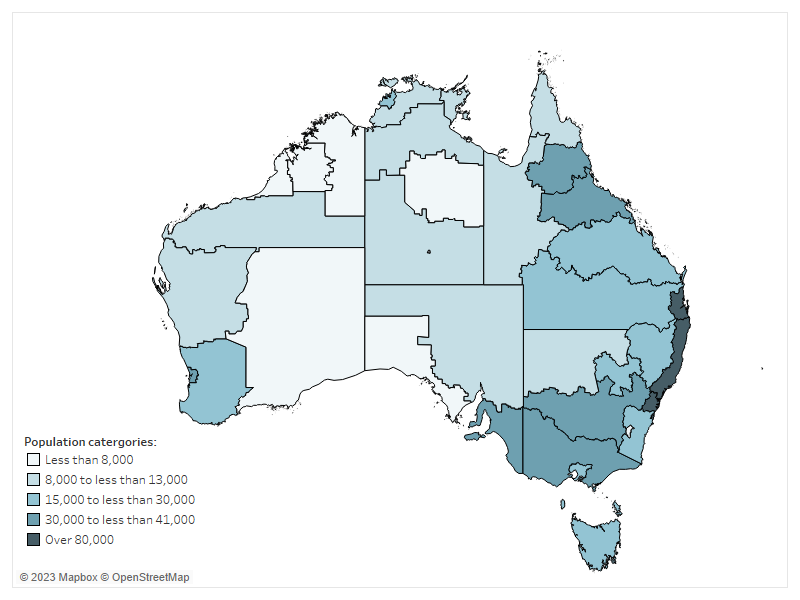
Chart: AIHW. Source: ABS 2016.
For the analyses in this report, 37 Indigenous Regions were able to be mapped to mortality and population data (Table A5).
| State/ territory | Indigenous Region |
|---|---|
| New South Wales |
|
| Victoria |
|
| Queensland |
|
| Western Australia |
|
| South Australia |
|
| Tasmania | Tasmania |
| Australian Capital Territory | ACT |
| Northern Territory |
|
Source: ABS 2016.
Mortality data
The total number of deaths come from the AIHW's National Mortality Database (NMD) which holds records for deaths in Australia from 1964 to 2021. The database comprises information about causes of death and other characteristics of the person, such as sex, age at death, area of usual residence and Indigenous status.
The cause of death data are sourced from the Registrars of Births, Deaths and Marriages in each state and territory, the National Coronial Information System and compiled and coded by the Australian Bureau of Statistics (ABS).
The AIHW website About our data – Deaths Data provides detailed information on the registration of deaths and coding of causes of death in Australia. The completeness, accuracy and coding of these data are described elsewhere (ABS 2022). The data quality statements underpinning the AIHW NMD can be found in the ABS’s quality declaration summary for Deaths, Australia and Causes of death, Australia.
Adjusting for under-identification of First Nations people in mortality data
Every year, a number of deaths of First Nations people are not identified as such when they are registered (ABS 2018). This might arise from the non-reporting of a deceased person’s Indigenous status on the death registration form (for example, the question is never asked, or the answer is not known), or from incorrect identification of a deceased person’s Indigenous status (recording an Aboriginal and Torres Strait Islander person as non-Indigenous, and vice versa). The net effect is an under-identification of First Nations people in the deaths data.
Adjustment factors to account for under-identification of First Nations people in death registration records have been produced from national and state/ territory data linkage studies. In the 2018 ABDS, mortality adjustment factors from the ABS’s Census Data Enhancement Indigenous Mortality Study (2015–17) (ABS 2018) were used to adjust First Nations deaths for under-identification in mortality data for the 2018 reference year. To maintain consistency, these factors were also used to adjust First Nations deaths for the calculation of avoidable percentages.
Dealing with small numbers
The number of deaths due to any cause varies from year to year. These fluctuations are more noticeable for causes that are less common and in First Nations deaths that are often small in number. To reduce the impact of random fluctuations, First Nations avoidable percentages were based on the annual average of 3 years of deaths data. For the 2018 reference year, First Nations deaths were averaged from deaths occurring in 2016, 2017 and 2018.
Redistribution issues
Some ICD-10 codes are not appropriate or valid causes of death for burden of disease analysis, either because they are implausible underlying causes (for example, hypertension), they are intermediate causes that have a precipitating cause (for example, septicaemia) or occur in the final stages of dying (for example, cardiac arrest), or they are recoded as ‘ill-defined’. Deaths assigned to these codes must be reallocated to one or more of the conditions defined on the ABDS cause list – this process is referred to as redistribution. Redistribution removes deaths from some causes, and increases the number of deaths for other causes, however the overall number of deaths is kept constant. Further details regarding methods for redistribution can be found in Australian Burden of Disease Study: Methods and supplementary material 2018 (AIHW 2021).
Some of the ICD10 codes used in the definition of avoidable deaths were allocated for redistribution in the ABDS (Table A1). Due to this aspect of burden of disease methodology there may be differences in the number of deaths reported here and in other mortality data studies.
Population data
Aboriginal and Torres Strait Islander backcast and projected population estimates as at 30 June 2018 (based on the 2016 Census) (ABS 2019) were used to calculate the rates for First Nations people presented in this report.
Non-Indigenous population estimates were calculated by subtracting the Aboriginal and Torres Strait Islander population estimates from the total Australian population estimates for the same years.