Comparisons over time
Changes in years of life lost (YLL) over time from specific diseases or injuries may be due to changes in population size, population ageing, changes in disease prevalence, epidemics or changes to how causes of deaths are recorded or coded.
Notable changes in coding practices over time includes deaths due to dementia and deaths due to poisoning (see technical notes for further detail). Therefore changes in deaths and fatal burden from dementia and poisoning over time needs to be interpreted with caution.
Changes in rates of fatal burden
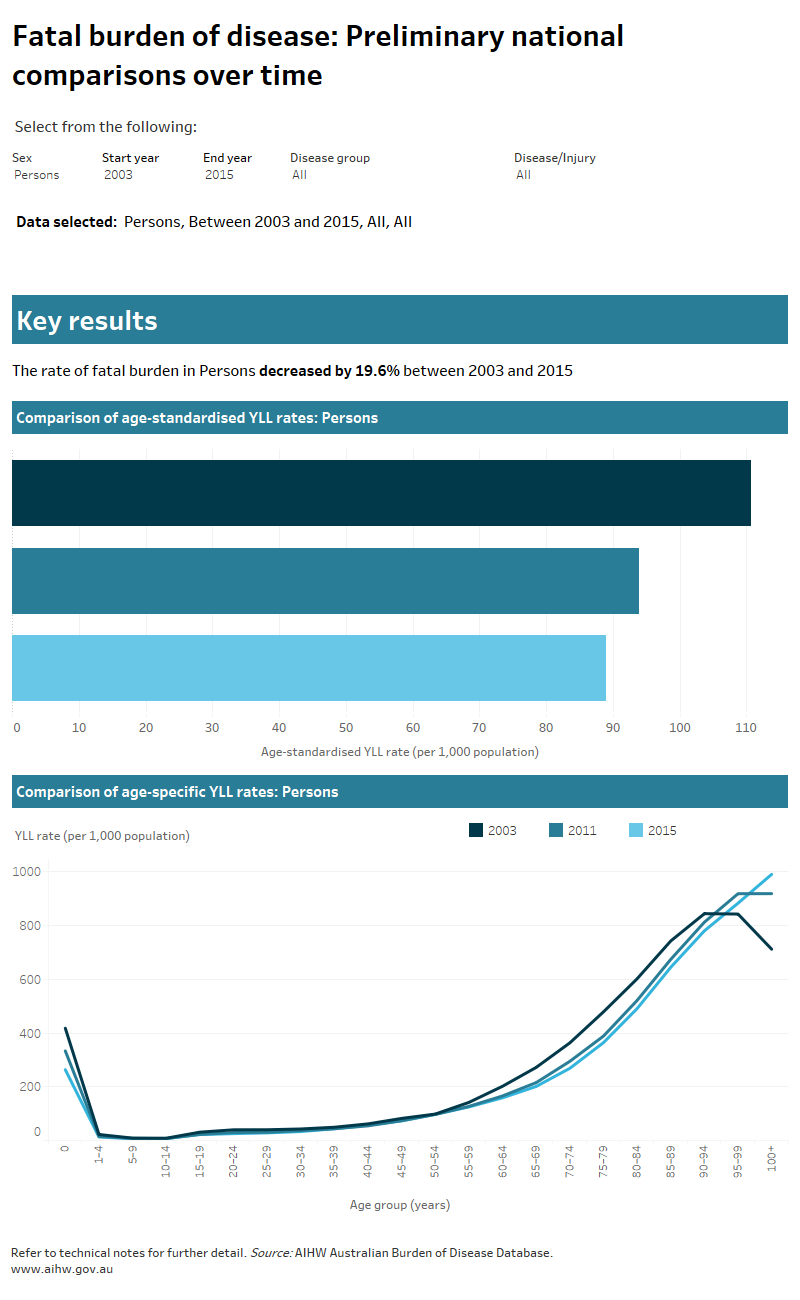
Use the ‘Comparison over time’ graphs to explore differences in age-standardised and age-specific rates of YLL in Australia between the years 2003, 2011 and 2015 by sex and for selected disease groups or diseases/injuries of interest.
Changes in leading causes of fatal burden
Leading causes of death and fatal burden (YLL) can be ranked by the number or by the age-standardised rate (ASR) in the population. The rate is adjusted for age, in order to compare between populations that have different age structures.
It is important to remember that an increase in rank over time does not always mean the disease or injury has increased in the population, and vice versa.
As YLL incorporates the age at which the death occurred, rankings of deaths and YLL will differ.
Use the ‘Rank by ASR’ interactive graph to explore the leading 25 causes of YLL in Australia, by age-standardised rate for the years 2003, 2011 and 2015, or the ‘Rank by number’ interactive graph to explore rankings by number of YLL.
Fatal burden of disease: Preliminary national comparisons over time data visualisation


