Who has different types of multimorbidity and what are their experiences?
Based on self-reported information from the 2017–18 NHS, people aged 45 and over with different types of multimorbidity had different characteristics and experiences. Poorer health experiences were generally associated with moderately and highly complex multimorbidity. People living with multimorbidity can be limited by these experiences (Dobson et al. 2020). See Box 7 for key considerations for interpreting these characteristics.
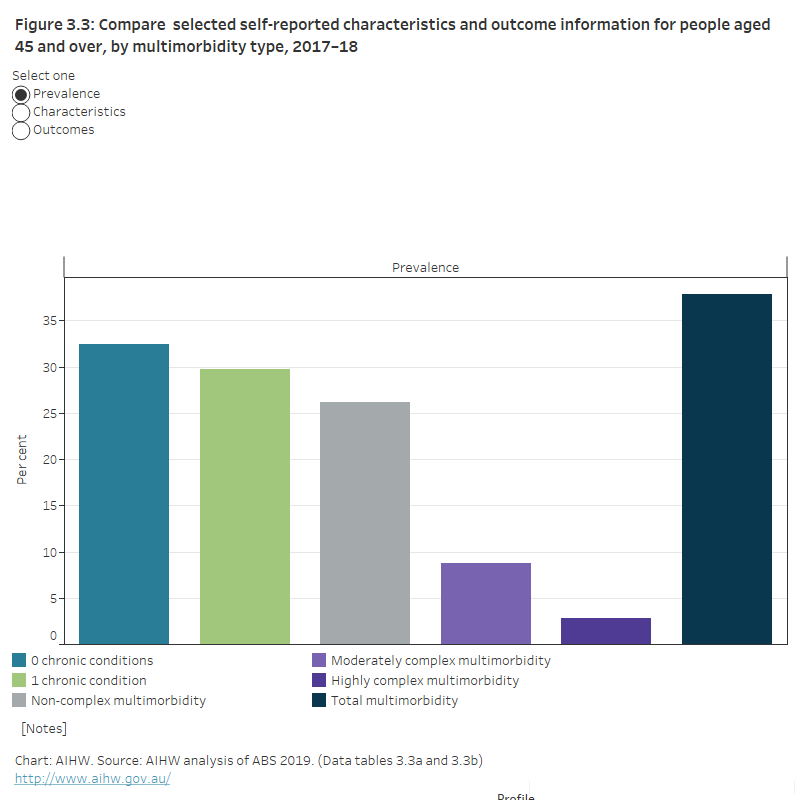
Figure 3.3: Selected self-reported characteristics and outcome information for people aged 45 and over, by multimorbidity type, 2017–18
This figure shows the proportion of people aged 45 and over with different multimorbidity types by several self-reported characteristics (including sex, overweight/obesity, current tobacco smoker) and outcomes (including working, bodily pain, disability, restriction or limitation). Compared with people with no chronic conditions, people aged 45 and over with multimorbidity were more likely to be older, women, overweight or obese, not sufficiently active, a current tobacco smoker.
Characteristics of people with multimorbidity and complex multimorbidity types
Multimorbidity is more common in older age groups (see What is multimorbidity and how common is it?). The characteristics of people aged 45 and over with different types of multimorbidity were compared with the characteristics of people with no chronic conditions in the same age group. Full details of each of the groups and characteristics examined is provided in the Data tables 3.3a–c. Some findings of interest are included below.
Overweight and obesity
Overweight and obesity are common in Australia—67% of Australians aged 18 and over were overweight or obese in 2017–18 (AIHW 2020). Overweight and obesity are even more common among people with multimorbidity and complex multimorbidity (Figure 3.3; Data table 3.3a). Among people aged 45 and over, the proportion of people who were overweight or obese in 2017–18 was:
- 70% for people with no chronic conditions
- 76% for people with 1 chronic condition
- 76% for people with non-complex multimorbidity
- 82% for people with moderately complex multimorbidity
- 84% for people with highly complex multimorbidity.
The proportion of people who were overweight or obese within each group was similar by age group (45–64 and 65 and over) (see Data tables 3.3b and 3.3c).
Smoking status
The following groups were used in analysis of smoking status: current (occasional or daily) smokers, ex-smokers and never smoked. In this analysis, smoking refers to tobacco smoking. See the section ‘Smoking status’ in Grouping data for analysis for further detail.
In 2017–18, people aged 45 and over with any type of multimorbidity (total multimorbidity) were more likely to be current smokers or ex-smokers, and less likely to have never smoked, compared with people with no chronic conditions (Figure 3.3; Data table 3.3a). The proportion of people who were current smokers was:
- 12% among those with no chronic conditions
- 13% among those with 1 chronic condition
- 14% among those with non-complex multimorbidity
- 19% each among those with moderately complex and highly complex multimorbidity.
The proportion of people who were current smokers decreased with age (45–64 and 65 and over) across each of the groups compared. The proportion of people with no chronic conditions who were current smokers was 14% among those aged 45–64, compared with 5.9% among those aged 65 and over. The largest decreases were among people with moderately or highly complex multimorbidity. Of those aged 45–64, nearly 1 in 3 people with moderately complex or highly complex multimorbidity were current smokers (31% and 32%, respectively). Among those aged 65 and over, almost 1 in 10 (9%) people with moderately complex or highly complex multimorbidity were current smokers.
In contrast, the proportion of people who were ex-smokers tended to increase by age group (45–64 and 65 and over) across the multimorbidity groups compared. The largest increase by age group was among people with moderately complex multimorbidity. The proportion of people who had never smoked was similar across age groups for most groups compared (see Data tables 3.3b and 3.3c).
Alcohol consumption
It is estimated that among people aged 45 and over, the proportion who consumed alcohol at levels that put them at lifetime risk of harm was similar among those with no chronic conditions and those with any type of multimorbidity (total multimorbidity).
The National Health and Medical Research Council guidelines for the consumption of alcohol are evidence-based recommendations that aim to reduce the health risks associated with alcohol consumption (NHMRC, 2020). The guidelines were updated in 2020 however, estimates here are based on the 2009 guidelines which were current at the time of the survey. Based on the 2009 guidelines, consuming more than 2 standard drinks per day, on average, puts a person at lifetime risk of harm. Information collected from NHS respondents about their alcohol consumption in the week prior to interview is used to estimate the prevalence of lifetime risk of alcohol harm in this analysis. See Grouping data for analysis in the Technical notes for details of the definitions and groups used in this analysis.
People with highly complex multimorbidity were less likely to consume alcohol at these levels than those with no chronic conditions (Figure 3.3; Data table 3.3a). The proportion of people at risk of long-term harm from alcohol was:
- 17% among people with no chronic conditions
- 20% among people with 1 chronic condition
- 18% among people with non-complex multimorbidity
- 13% among people with moderately complex multimorbidity
- 11% among people with highly complex multimorbidity.
There was little difference in the proportion of people who exceeded alcohol consumption guidelines across age groups (45–64 and 65 and over, see Data tables 3.3b and 3.3c).
See Grouping data for analysis in the Technical notes for further detail on how lifetime risk of alcohol harm is estimated, and the groups used in this analysis.
Box 7: Key considerations for interpreting common characteristics
It is important to note that while some characteristics, including age, sex or smoking status, may be more common in people with multimorbidity, it is not possible to say that multimorbidity is caused by these characteristics with the current data. Similarly, it is not possible to say that the characteristics examined are the result of having multimorbidity. For example, while being overweight or obese may be a risk factor for multimorbidity, it could also be the result of a person being limited in the physical activity they can participate in as a result of their multimorbidity. Longitudinal information on when a person developed multimorbidity, and when they became overweight or obese would be needed to understand this, but is not available within the NHS.
Experiences of people living with multimorbidity and complex multimorbidity types
The experiences of people aged 45 and over with different types of multimorbidity were compared with the experiences of people with no chronic conditions in the same age group.
Full detail on each of the groups and outcomes examined is provided in the Data tables 3.3a–c. Selected findings are presented below for people aged 45 and over in 2017–18.
Labour force participation
Consistent with findings for people aged 18–64 (see Who has multimorbidity and what are their experiences?), and after adjusting for age, people aged 45–64 with any type of multimorbidity (total multimorbidity) were less likely to be working than people with no chronic conditions in the same age group. The difference is greatest when comparing the proportion of people working among those with no chronic conditions and with any type of complex multimorbidity (including moderately and highly complex multimorbidity).
In 2017–18, age-adjusted proportions of those working among people aged 45–64 were:
- 82% among those with no chronic conditions
- 77% among those with 1 chronic condition
- 68% among those with non-complex multimorbidity
- 47% among those with any type of complex multimorbidity (Data table 3.3b).
Bodily pain
Most people with multimorbidity experienced bodily pain in the 4 weeks prior to the survey. This proportion increased with multimorbidity complexity (Figure 3.3; Data table 3.3a). Among those aged 45 and over, it is estimated that bodily pain was experienced by:
- 56% of those with no chronic conditions
- 75% of people with 1 chronic condition
- 87% of people with non-complex multimorbidity
- 93% of people with moderately complex multimorbidity
- 97% of people with highly complex multimorbidity.
The experience of bodily pain did not change with age; the prevalence of bodily pain was similar between those aged 45–64 and 65 years and over for all types of multimorbidity (see Data tables 3.3b and 3.3c).
Self-assessed health
In the 2017–18 NHS, survey participants were asked “In general would you say that your health is excellent, very good, good, fair or poor?” In this analysis, those who rated their health as ‘fair’ or ‘poor’ were grouped under the label poor self-assessed health.
Those with more complex types of multimorbidity were more likely to have poor self-assessed health compared with those with less complex multimorbidity (Figure 3.3; Data table 3.3a). Among people aged 45 and over, poor self-assessed health was experienced by:
- 5.4% of those with no chronic conditions
- 15% of those with 1 chronic condition
- 30% of those with non-complex multimorbidity
- 51% of those with moderately complex multimorbidity
- 74% of those with highly complex multimorbidity.
Self-assessed health status was similar across those aged 45–64 and 65 years and over among people in each of the groups examined (see Data tables 3.3b and 3.3c).
See Grouping data for analysis in the Technical notes for further detail on how self-assessed health is estimated, and the groups used in this analysis.
ABS (Australian Bureau of Statistics) 2019. Microdata: National Health Survey, 2017–18, DataLab. ABS cat. no. 4324.0.55.001. Canberra: ABS. Findings based on Detailed Microdata.
AIHW (Australian Institute of Health and Welfare) 2020. Overweight and obesity. Canberra: AIHW. Viewed 16 July 2020.
Dobson A, Forder P, Hockey R, Egan N, Cavenagh D, Waller M et al. 2020. The impact of multiple chronic conditions: Findings from the Australian Longitudinal Study on Women’s Health. Report prepared for the Australian Government Department of Health, May 2020.
NHMRC (National Health and Medical Research Council) 2020. Australian guidelines to reduce health risks from drinking alcohol. Canberra: NHMRC.