Mortality
Page highlights:
- In 2021, chronic kidney disease contributed to around 20,000 deaths in Australia – 12% of all deaths.
- In 2021, Aboriginal and Torres Strait Islander Australians were 4 times as likely to die from chronic kidney disease as non‑Indigenous Australians.
Chronic kidney disease (CKD) may be listed as the underlying cause of death – or, more commonly, as an associated cause – on a death certificate where another condition is listed as the underlying cause.
In 2021, chronic kidney disease contributed to around 20,000 deaths in Australia – 12% of all deaths.
Of these, CKD was listed as an underlying cause of death in around 4,600 cases (23% of all CKD deaths). It was recorded as an associated cause in a further 15,400 deaths (around 77% of CKD deaths). Deaths with CKD as an underlying or associated cause accounted for 12% of all deaths in Australia in 2021.
Linked data from the Australia and New Zealand Dialysis and Transplant (ANZDATA) Registry and National Death Index has shown that CKD, particularly kidney failure, is often an under-reported cause of death (AIHW 2016).
Diseases commonly listed as underlying causes of death where chronic kidney disease is an associated cause
In cases where CKD was an associated cause of death, the most common groups of underlying causes were:
- diseases of the circulatory system (33%)
- cancers (20%)
- endocrine, nutritional and metabolic diseases (9.4%)
- diseases of the respiratory system (8.0%).
More specifically, the most common underlying causes of death, by 3-digit International Statistical Classification of Diseases and Related Health Problems, 10th Revision (ICD-10) code, were:
- chronic ischaemic heart disease (10.8%)
- acute myocardial infarction (4.4%)
- heart failure (4.2%)
- other chronic obstructive pulmonary disease (4.1%).
- type 2 diabetes mellitus (4.0%)
- unspecified dementia (4.0%)
In about a third of cases where CKD was listed as an associated cause of death, the underlying cause was a disease of the circulatory system. This reflects the common comorbidity of CKD and cardiovascular diseases (see Comorbidity of chronic kidney disease for more information).
Epidemiological data also suggest that individuals with CKD are at increased risk of experiencing cognitive impairment and of developing dementia (Bugnicourt et al. 2013). This may explain why CKD is commonly listed as an associated cause of death in deaths due to unspecified dementia.
In cases where CKD was the underlying cause of death, the most common groups of associated causes included:
- diseases of the circulatory system (41%) – such as heart failure (10%), primary hypertension (8.3%) and chronic ischaemic heart disease (5.2%)
- endocrine, nutritional and metabolic diseases (14%) – such as type 2 and unspecified diabetes mellitus (5.7% and 3.9%, respectively)
- diseases of the respiratory system (8.0%) – such as pneumonia, organism unspecified (1.9%) and other chronic obstructive pulmonary disease (1.8%)
- diseases of the genitourinary system (6.8%) – such as acute kidney failure with tubular necrosis (5.2%).
Trends over time
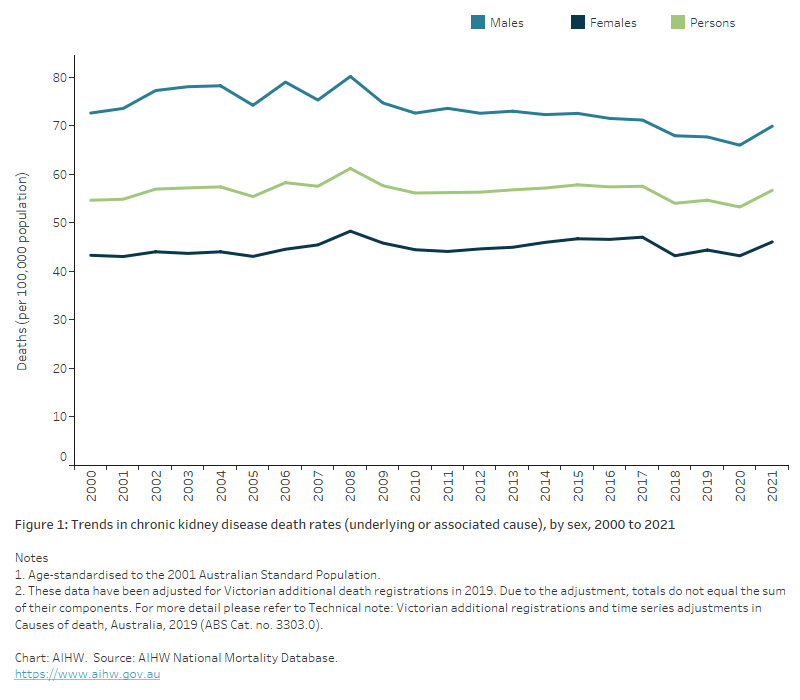
The number of deaths with CKD as an underlying or associated cause rose by 97% between 2000 and 2021 (10,200 and 20,000 deaths). After accounting for changes in the age structure of the population over this time, the rate of CKD deaths remained relatively stable between 2000 and 2021.
Between 2000 and 2021:
- the death rates for males ranged between 66 and 80 deaths per 100,000 population, after adjusting for age (Figure 1)
- the death rate for females was consistently lower than for males, ranging between 43 and 48 deaths per 100,000 population, after adjusting for age (Figure 1).
Figure 1: Trends in chronic kidney disease death rates (underlying or associated cause), by sex, 2000 to 2021
The chart shows the age-standardised trend in chronic kidney disease death rates (as an underlying or associated cause) between 2000 and 2021. Chronic kidney disease death rates peaked in 2008 to be 80 and 48 per 100,000 among males and females respectivelyand have declined since then to be 70 and 46 per 100,000.

Variation by age and sex
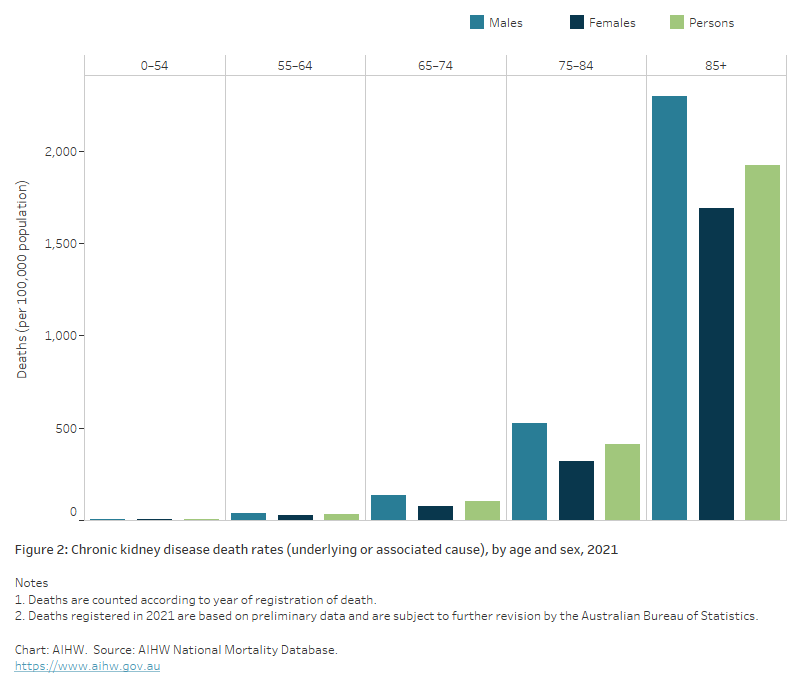
In 2021, death rates for CKD as an underlying or associated cause:
- were 1.5 times as high in males as in females
- were higher in males than females across all age groups
- increased with age and were much higher in the 85 and over age group. This age group accounted for 52% of all deaths due to CKD in 2021 and had an age‑specific death rate that was 4.7 times as high as for people aged 75–84 (1,900 and 414 deaths per 100,000 population) (Figure 2).
Figure 2: Chronic kidney disease death rates (underlying or associated cause), by age and sex, 2021
The chart shows the chronic kidney disease death rates (underlying or associated cause) by age and sex in 2021. Chronic kidney disease death rates were highest among males and females aged 85 and over (2,300 and 1,700 per 100,000 population).

Variation between population groups
Aboriginal and Torres Strait Islander people
In 2019–2021, CKD contributed to around 1,900 deaths (as an underlying or associated cause) among Indigenous Australians in jurisdictions with adequate Indigenous identification, a rate of 85 per 100,000 population. These deaths accounted for around 3.8% of all deaths due to CKD during this period.
Indigenous females had higher numbers of deaths than Indigenous males (1,041 and 890, respectively).
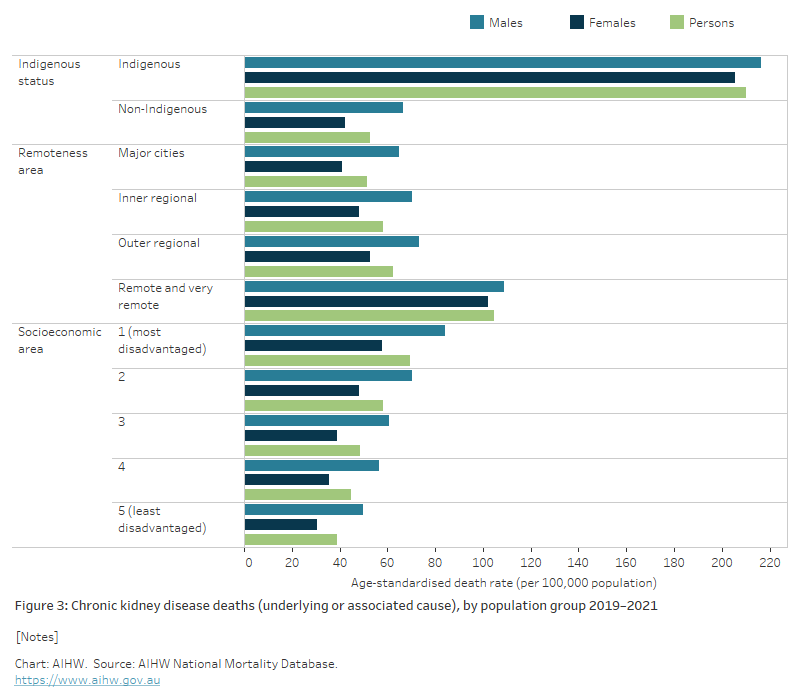
Indigenous Australians were 4 times as likely to die from CKD as non‑Indigenous Australians, after adjusting for age.
This difference was greater in females than in males. CKD death rates for Indigenous females and males were 4.9 and 3.3 times as high, respectively, compared with their non-Indigenous counterparts (Figure 3).
Remoteness and socioeconomic area
In 2021, the age-standardised death rate for CKD (as an underlying or associated cause of death) was higher in Remote and very remote areas and in areas with increased socioeconomic disadvantage.
- Death rates in Remote and very remote areas were twice as high as in Major cities. This difference was greater for females than males (2.5 times as high for females and 1.7 times as high for males).
- The mortality rate was higher in males than females across all remoteness areas.
- The difference between male and female death rates was greatest in Major cities and lowest in Remote and very remote areas.
- Death rates were 1.8 times as high in the lowest socioeconomic area than in the highest socioeconomic area.
- Males had a higher death rate than females across all socioeconomic areas (Figure 3).
Figure 3: Chronic kidney disease deaths (underlying or associated cause), by population group, 2019–2021
The chart shows the age-standardised chronic kidney disease death rates as the underlying and/or associated cause by selected population group and sex in 2019–2021. Overall, chronic kidney disease death rates increased with increasing levels of socioeconomic disadvantage being 1.8 times as higher among those living in the most disadvantaged areas as those living in the least disadvantaged areas. Chronic kidney disease death rates also increase with the level of remoteness being 2.0 times as high among those living in Remote and very remote areas as Major cities.

References
AIHW (Australian Institute of Health and Welfare) (2016) Incidence of end-stage kidney disease in Australia 1997–2013, catalogue number PHE 211, AIHW, Australian Government, accessed 7 February 2021.
Bugnicourt JM, Godefroy O, Chillon JM, Choukroun G and Massy ZA (2013) Cognitive disorders and dementia in CKD: the neglected kidney–brain axis, Journal of the American Society of Nephrology, 24(3):353–363, doi:10.1681/ASN.2012050536.


