Unemployment
Unemployment rate
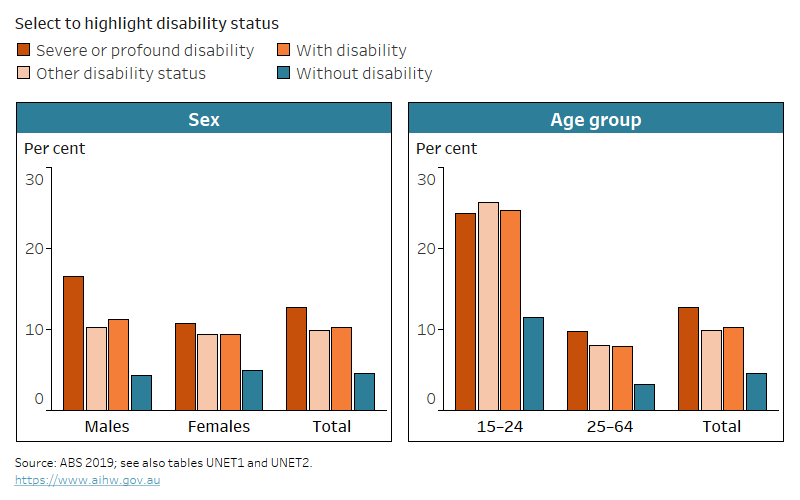
In 2018, people aged 15–64 with disability were twice as likely to be unemployed (10%) as those without disability (4.6%).
Unemployment and severity of disability
In 2018, 13% of people aged 15–64 with severe or profound disability were unemployed compared with 9.9% of people with other disability status.
Unemployment among young people
In 2018, people aged 15–24 with disability were more than twice as likely to be unemployed (25%) as those aged 25–64 (7.9%).
On this page:
Introduction
People aged 15–64 with disability are more likely to be unemployed than those without disability. They are also more likely to be unemployed for longer.
How is unemployment defined?
Unemployed people are those who reported that they were not employed during the reference week (the full week before the date of their survey interview), and had actively looked for full- or part-time work at any time in the 4 weeks up to the end of the reference week and were available for work in the reference week.
Data note
Data on this page are sourced from the Australian Bureau of Statistics (ABS) 2018 Survey of Disability, Ageing and Carers (SDAC). For more information about the SDAC, including the concepts of disability, disability severity, disability groups, and remoteness categories used by the SDAC, see ‘Data sources’.
All data reported on this page refer to 2018.
Unemployment rate
People aged 15–64 with disability are more likely to be unemployed than those without disability. The unemployment rate of people aged 15–64 with disability is 10% (or 113,000 unemployed), twice that of those without disability (4.6%, or 544,000 unemployed) (Figure UNEMPLOYMENT.1). The unemployment rate is 13% (or 17,000 unemployed) among people aged 15–64 with severe or profound disability and 9.9% (or 95,000 unemployed) among those with other disability status (Figure UNEMPLOYMENT.1).
Unemployment rate
In this report, the unemployment rate is the population aged 15–64 who are unemployed expressed as a percentage of the population aged 15–64 who are in the labour force.
Figure UNEMPLOYMENT.1: Unemployment rate for people in the labour force, by disability status and severity, sex and age group, 2018
The chart shows people with disability are more likely to be unemployed than those without disability (7.9% and 3.2% in the 25–64 age group).

Notes:
* Relative standard error of 25–50% and should be used with caution.
- Restricted to people in the labour force aged 15–64 living in households.
- Figures are rounded and underwent ABS confidentiality and perturbation processes.
Source data tables: Data tables – Unemployment. View data tables
Young people (aged 15–24) with disability (25% or 38,000) are much more likely than those aged 25–64 (7.9% or 75,000) to be unemployed (Figure UNEMPLOYMENT.1). The unemployment rate is similar for males aged 15–64 with disability (11%, or 63,000 unemployed) and females (9.4%, or 50,000 unemployed) (Figure UNEMPLOYMENT.1).
Of people aged 15–64 with disability, those with sensory and speech disability (8.2% or 18,000) or physical restriction (9.8% or 62,000) are less likely to be unemployed than those with psychosocial disability (24% or 51,000) or intellectual disability (18% of 23,000) (ABS 2019).
The unemployment rate for people aged 15–64 with disability has increased in recent years (8.4% in 2003 to 10% in 2018) while remaining relatively steady for those without disability (around 5% between 2003 and 2018) (ABS 2019).
Australia’s Disability Strategy reporting
Disability unemployment gap and young people in employment are measures reported under the Australia’s Disability Strategy Outcomes Framework. For more information, including trends and comparisons by population groups, please see Unemployment gap and Young people in employment on Reporting on Australia’s Disability Strategy 2021–2031 website.
Duration of unemployment
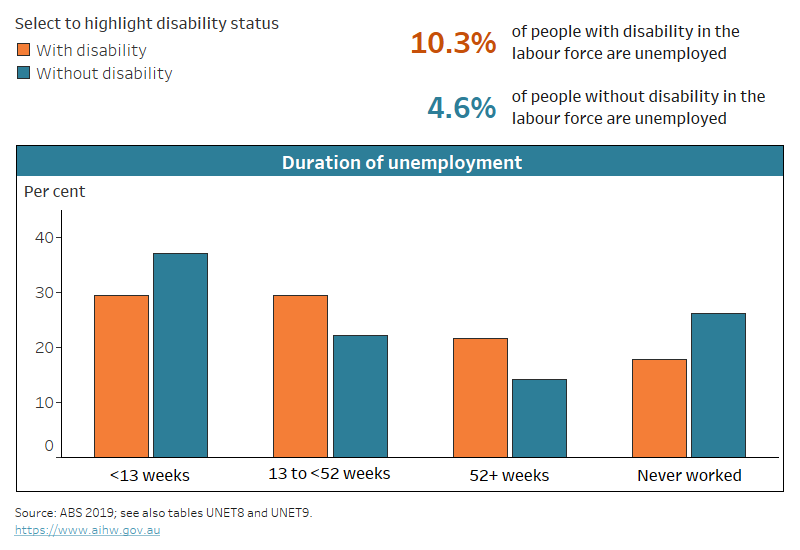
People aged 15–64 with disability are more likely to be unemployed for longer periods than those without disability – 22% (or 24,000) of unemployed people with disability have been unemployed for at least one year (52 weeks or more), compared with 14% (or 73,000) without disability (Figure UNEMPLOYMENT.2). At the same time, unemployed people without disability are more likely to have never worked (26% or 135,000) than unemployed people with disability (18% of 20,000). This may be in part because younger people (aged 15–24) make up a larger proportion of unemployed people without disability than of unemployed people with disability, and younger people are most likely to have never worked.
Figure UNEMPLOYMENT.2: Duration of unemployment for unemployed people, by disability status, 2018
The chart shows 22% of unemployed people aged 15–64 with disability have been unemployed for at least one year and 14% of those without disability.

Notes:
- Restricted to unemployed people aged 15–64 living in households.
- Figures are rounded and underwent ABS confidentiality and perturbation processes.
Source data tables: Data tables – Unemployment. View data tables
Main activity since last looked for work
Around one-quarter (26% or 30,000) of unemployed people aged 15–64 with disability report home duties, or caring for children or other person(s) as their main activity since they last looked for work (Table UNEMPLOYMENT.1). This is less common among unemployed males aged 15–64 with disability (13% or 9,000) than their female counterparts (45% or 23,000). It is also less common among unemployed males aged 15–64 with disability than those without disability (22% or 58,000) (ABS 2019).
Unemployed people aged 15–64 with disability (20% or 22,000) are less likely than those without disability (29% or 157,000) to say their main activity since they last looked for work was attending an educational institution. However, almost 1 in 4 (23%) of those with disability say their main activity was related to their own illness, injury long-term health condition, or disability (ABS 2019).
Selected main activities since last looked for work | With disability | Without disability |
|---|---|---|
Home duties, or caring for child(ren) or other person(s) | 26.4 | 33.7 |
Attending an educational institution | 19.8 | 28.8 |
Short-term illness or injury, long-term health condition or disability | 22.9 | 1.5* |
Notes:
* Relative standard error of 25%–50% and should be used with caution.
- Restricted to people aged 15–64 living in households.
- ‘Caring for other persons’ refers to caring for ill, disabled, or elderly person(s).
- Categories not shown are: retired or voluntarily inactive, travel, holiday or leisure activity, working in unpaid voluntary job, and other.
- Figures are rounded and underwent ABS confidentiality and perturbation processes.
Source: ABS 2019; see also Table UNET10, Data tables – Unemployment. View data tables
ABS (Australian Bureau of Statistics) (2019) Microdata: disability, ageing and carers, Australia, 2018, ABS cat. no. 4430.0.30.002, AIHW analysis of TableBuilder data, accessed 4 August 2021.


