Finances
Satisfaction with financial situation
In 2021, 33% of people with disability aged 15–64 were not satisfied with their financial situation, compared with 14% of people without disability.
Raising emergency funds
As at 2021, 25% of people with disability aged 15–64 would not have been able to raise $3,000 in a week for an emergency, compared with 9.4% without disability.
Financial stress
In 2021, 8.8% of people with disability aged 15–64 went without meals due to a shortage of money, compared with 2.3% without disability.
On this page:
Introduction
People with disability tend to be worse off financially than those without disability. This can affect their ability to raise funds in an emergency, pay bills or buy food. Some people with disability may need to seek help from friends, family or welfare and community organisations because of financial problems.
Data note
Data on this page are sourced from the 2021 Household, Income and Labour Dynamics in Australia (HILDA) Survey. For more information about HILDA, including the concepts of disability, disability severity, disability groups, and remoteness categories used by the HILDA Survey, see ‘Data sources’.
Self-Completion Questionnaire
In addition to personal face-to-face interviews, survey participants are asked to complete a self-completion questionnaire. The questionnaire includes questions about some aspects of financial situation, such as prosperity, ability to raise emergency funds, and stressful financial events.
Prosperity and financial situation
Prosperity
Each year, HILDA Survey participants are asked to assess their own and their family's prosperity given their current needs and financial responsibilities.
In 2021, around 1 in 3 (32%) people with disability aged 15–64 described their prosperity as ‘just getting along’ and nearly 1 in 12 (8.0%) said they were poor or very poor, compared with 18% and 1.6% of those without disability. People aged 65 and over in general have a more favourable assessment of their prosperity than those aged 15–64; however, even in the 65 and over age group people with disability were more likely to say they are ‘just getting along’ (27%) or are poor or very poor (2.3%) than those without disability (14% and 1.4%*, respectively (*estimate unreliable)) (DSS and MIAESR 2022).
Of people aged 15–64 with disability, those with severe or profound disability are more likely to say they are ‘just getting along’ or are ‘poor/very poor’ (53% combined for the 2 groups) than those with other disability status (39%) (DSS and MIAESR 2022).
Satisfaction with financial situation
Each year, HILDA Survey participants are asked to rate their satisfaction with their financial situation on a 0–10 scale. Ten represents the highest level of satisfaction and 0 the lowest (DSS and MIAESR 2022). In this analysis, people who indicate a satisfaction level between 0 and 5 are referred to as not satisfied (unsatisfied) with their financial situation.
People with disability aged 15–64 are more likely to be unsatisfied with their financial situation than those without disability (33% compared with 14% in 2021). Older people with disability (aged 65 and over) are less likely (16%) to be unsatisfied with their financial situation than those with disability aged 15–64 (33%), but more likely than people aged 65 and over without disability (9.2%) (DSS and MIAESR 2022).
Of people with disability aged 15–64:
- males are about as likely to be unsatisfied with their financial situation as females (both 33%)
- those with severe or profound disability are more likely to be unsatisfied (44%) than those with other disability status (32%)
- 45% of those with psychosocial disability and 43% with intellectual disability are unsatisfied with their financial situation, as are 36% of people with physical disability and 31% of those with sensory disability (DSS and MIAESR 2022).
Ability to raise emergency funds
What is meant by raising emergency funds?
In the HILDA Survey, emergency funds are defined as $3,000 to be raised for an emergency within one week.
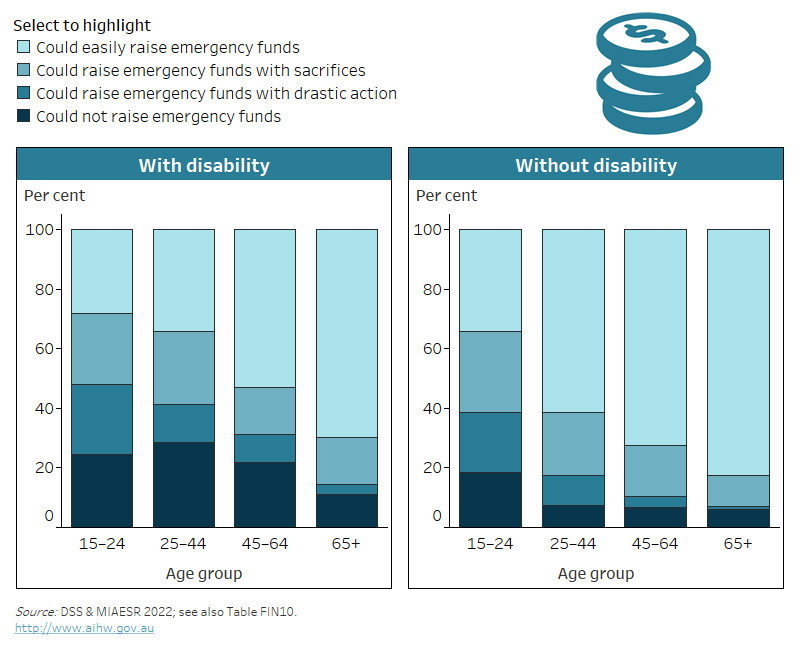
Having to raise $3,000 for an emergency within one week could be a problem for many people with disability. In 2021:
- 25% of people with disability aged 15–64 said they would not be able to raise emergency funds
- 13% would have to take drastic action, such as selling an important possession
- 20% would have to make sacrifices, such as reduce spending or selling a possession
- 43% could easily raise emergency funds (DSS and MIAESR 2022).
People without disability aged 15–64 are more likely (60%) to be able to easily raise emergency funds, and less likely to be unable to raise emergency funds (9.4%), than those with disability (DSS and MIAESR 2022).
The ability to raise emergency funds increases with age. People with disability aged 65 and over are more than twice as likely (70%) to be able to easily raise emergency funds than those aged 15–24 (28%) (Figure FINANCES.1).
Of people aged 15–64 with disability:
- those with severe or profound disability are less likely (33%) to be able to easily raise emergency funds than those with other disability status (44%)
- males (45%) are about as likely as females (42%)
- those in Major cities are more likely (46%) than those in Inner regional areas (39%)
- those with intellectual disability or psychosocial disability are least likely (23% and 29%, respectively) to be able to easily raise emergency funds
- those with physical or sensory disability are most likely to be able to easily raise emergency finds (42% and 39%, respectively) (DSS and MIAESR 2022).
Figure FINANCES.1: Ability to raise emergency funds, by disability status and age group, 2021
This chart shows that of people aged 45–64 with disability, 22% would not be able to raise emergency funds, compared with 6.8% without disability.

Notes:
* Relative standard error of 25–50% and should be used with caution.
- Emergency funds include raising $3,000 for an emergency within one week.
- ‘Sacrifices’ include reduced spending or selling a possession.
- ‘Drastic action’ includes selling an important possession.
Source data tables: Data tables – Finances. View data tables
Financial stress
Financial stress
People are classified as in financial stress if they have experienced at least 2 out of 7 stressful financial events in recent months because of a shortage of money. Stressful financial events asked about in the HILDA Survey include:
- could not pay electricity, gas or telephone bills on time
- could not pay the mortgage or rent on time
- pawned or sold something
- went without meals
- were unable to heat home
- asked for financial help from friends or family
- asked for help from welfare/community organisations (Wilkins et al. 2019).
People who did not complete the HILDA self-completion questionnaire for all 7 stressful financial events were excluded from this analysis.
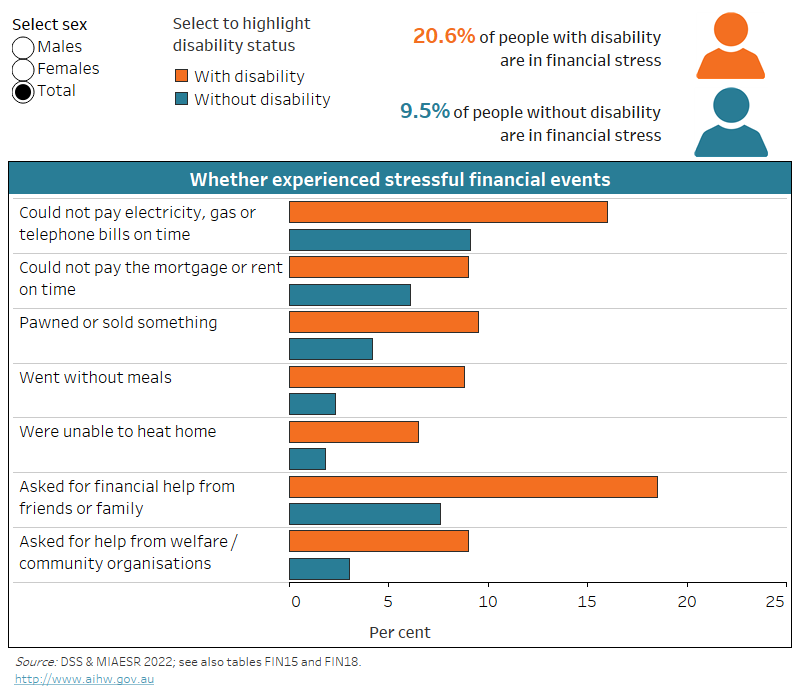
In 2021, people with disability aged 15–64 were more than twice as likely (21%) to have experienced financial stress as those without disability (9.5%). People with disability aged 65 and over are less likely (5.8%) to have experienced financial stress than people with disability aged 15–64, but more likely than people without disability aged 65 and over (3.4%). Of those aged 15–64 with disability:
- males are about as likely (19%) to have experienced financial stress as females (22%)
- those aged 25–44 are more likely (28%) to have experienced financial stress than those aged 45–64 (17%)
- people with psychosocial disability are somewhat more likely (31%) than those with physical disability (22%) (DSS and MIAESR 2022).
People with disability aged 15–64 are more likely to have experienced stressful financial events because of a shortage of money in the current year than those without disability. In 2021:
- around 1 in 5 (19%) of those with disability asked for financial help from friends or family, compared with 7.6% of those without disability
- 1 in 6 (16%) could not pay electricity, gas or telephone bills on time, compared with 9.1%
- almost 1 in 10 (9.5%) pawned or sold something, compared with 4.2%
- 1 in 11 (9.0%) asked for help from welfare or community organisations, compared with 3.0%
- 1 in 11 (9.0%) could not pay the mortgage or rent on time, compared with 6.1%
- 1 in 12 (8.8%) went without meals, compared with 2.3%
- 1 in 15 (6.5%) were unable to heat their home, compared with 1.8% (Figure FINANCES.2).
Figure FINANCES.2: Whether people aged 15–64 experienced stressful financial events, by sex and disability status, 2021
The chart shows people with disability are more likely to experience stressful financial events, like inability to pay bills on time (16% and 9.1%).

Notes:
- ‘Financial stress’ includes experiencing at least 2 out of 7 stressful financial events in the current calendar year.
- This analysis is restricted to people who responded to all 7 financial stress events questions.
Source data tables: Data tables – Finances. View data tables
Motor vehicle ownership
Having access to a motor vehicle can make it easier for people to get to places they need to reach. However, for some people the costs of owning and maintaining a motor vehicle may be too high. In 2018, as part of the Material Deprivation Module, the HILDA Survey asked one member of each responding household whether the household had a motor vehicle, and if not, whether this was because they could not afford it.
In 2018, most people with disability (92%) had a motor vehicle in their household (DSS and MIAESR 2019). However, people with disability are more likely to live in households that have no motor vehicle than those without disability:
- 7.0% of people with disability aged 15–64 live in households without a motor vehicle (compared with 3.3% of those without disability)
- 9.7% of people with disability aged 65 and over (compared with 4.7% of those without disability).
More than 2 in 5 (43%) people with disability aged 15–64 who do not have a motor vehicle in their household say that it is because they cannot afford it (DSS and MIAESR 2019).
Superannuation withdrawal under COVID-19 scheme
During 2019–20 and 2020–21, the Australian Government provided an opportunity for early access to superannuation to people affected by the COVID-19 crisis. Those eligible could withdraw up to $10,000 of their superannuation in 2019–20 and a further $10,000 in 2020–21. In 2021, HILDA survey participants were asked whether they withdrew any superannuation under the COVID-19 scheme during the last financial year (2020–21).
About 1 in 9 (11%) people with disability aged 15–64 said they withdrew superannuation, compared with 8.4% of people without disability. Males with disability were more likely to withdraw their superannuation than females (14% compared with 8.7%) (DSS and MIAESR 2022).
DSS (Department of Social Services) and MIAESR (Melbourne Institute of Applied Economic Social Research) (2019) The Household, Income and Labour Dynamics in Australia (HILDA) Survey, General Release 18, wave 18, doi:10.26193/IYBXHM, Australian Data Archive (ADA) Dataverse, AIHW analysis of unit record data, accessed 17 December 2021.
DSS and MIAESR (2022) The Household, Income and Labour Dynamics in Australia (HILDA) Survey, General Release 21, wave 21, doi:10.26193/KXNEBO, ADA Dataverse, V3, AIHW analysis of unit record data, accessed 7 December 2022.
Wilkins R, Lass I, Butterworth P and Vera-Toscano E (2019) The Household, Income and Labour Dynamics in Australia Survey: selected findings from waves 1 to 17, Melbourne Institute: Applied Economic and Social Research, University of Melbourne, accessed 4 August 2021.


