Area of spending
This stacked bar chart shows a breakdown of the expenditure that can be reported by disease group across each area of expenditure.

Figure 2 below shows how total health spending for 2020–21 as reported in Health expenditure Australia 2021–22 relates to spending in this disease expenditure study.
Figure 2: Areas of health spending included in the disease expenditure study 2020–21
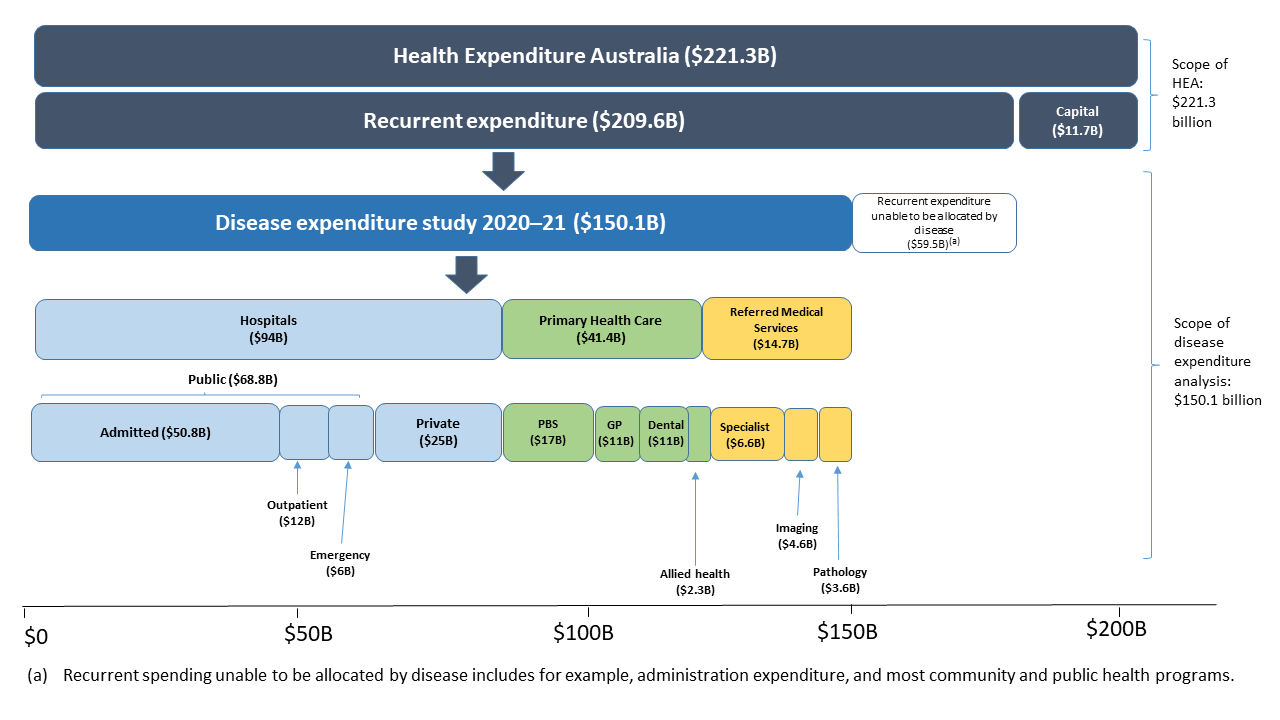
Source: AIHW Disease expenditure database and AIHW Health expenditure database.
Some components of recurrent spending are allocated differently between the health expenditure Australia database, and the disease expenditure study. This approach was taken to reflect patterns of healthcare use for particular conditions, which is the focus of this body of work, rather than health funding arrangements. For example:
- Public hospitals spending is further reported as emergency department, admitted patient, and outpatient clinic spending in this study.
- This study includes $1.6 billion of highly specialised PBS drugs dispensed in hospitals as PBS spending, which is a component of primary health care, while the health expenditure database reports this as hospital spending.
- In this disease expenditure study, $7.1 billion of MBS services provided in hospitals as part of an admission are allocated to public and private hospitals, while the majority of this spending is counted in referred medical services in the health expenditure database.
- In this study, health research has not been included as part of the disease expenditure database but there is a separate research section in this report that reflects on National Health and Medical Research Council (NHMRC) expenditure for disease, research and health areas presented according to the International Classification of Disease.
The visualisation below (Figure 3) shows spending for the broad areas of expenditure in this disease expenditure study compared to recurrent health spending for 2020–21 reported in Health expenditure Australia. Data used to create the visualisation is available to download from the data tables. For further information on methods used to derive the expenditure reported, please refer to Technical notes in this web report and the Health system spending on disease and injury in Australia: Overview of analysis and methodology 2020–21 report.
Figure 3: Disease expenditure and recurrent expenditure by broad area of expenditure, 2020–21
This bar chart shows a comparison of 2020–21 Health vs. Disease Expenditure Database spending.

Two charts, first a butterfly chart with expenditure by age group and sex. The second a bar chart with spending by area, sex and age group.
