Comparison with 2019–20 and across time series
Estimated spending by disease increased by $11.7 billion (in current prices) to $150.1 billion in 2020–21, up from $138.4 billion in 2019–20. This was an overall growth of 8.5% in nominal terms (current prices). This compares to a nominal growth of 9.2% in total health spending in 2020–21 reported in Health expenditure Australia 2021–22. As the disease expenditure study allocates around 72% of recurrent health spending to disease groups, the growth in spending on those areas of expenditure that are excluded from the disease expenditure study such as public health may have contributed to the higher overall growth in total health spending, due to the large increase in public health spending during the time of the COVID–19 pandemic.
Overall rank of disease groups
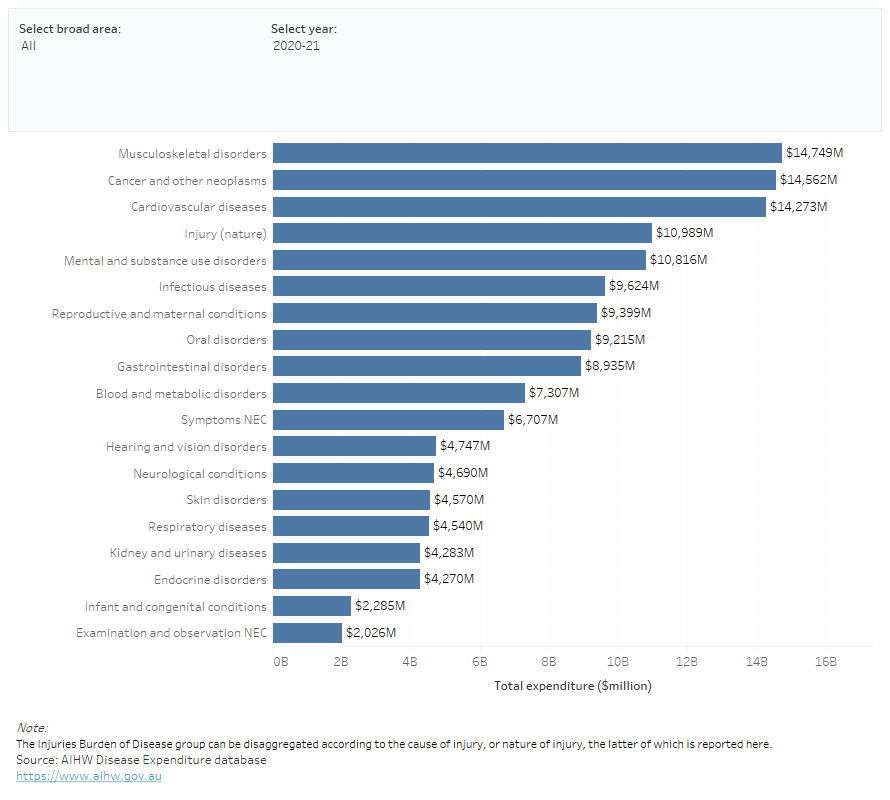
- Musculoskeletal disorders, Cardiovascular diseases and Cancers and other neoplasms were the top 3 disease groups in terms of spending throughout the decade from 2011–12 to 2020–21, accounting for just under one-third of all disease spending each year.
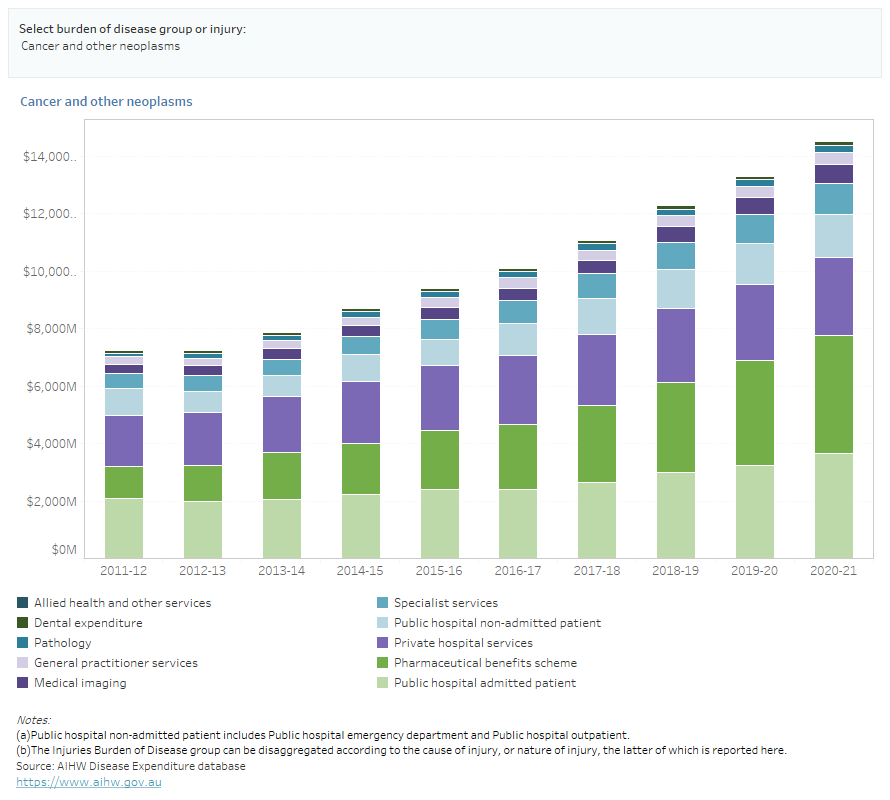
- Spending on Cancer and other neoplasms doubled from $7.3 billion in 2011–12 to $14.6 billion in 2020–21 (moved from rank 3 to rank 2 in terms of spending).
- Musculoskeletal disorders ranked the highest in terms of spending for 4 of the past 5 years, the exception was in 2019–20.
- In 2016-17 Infectious diseases was the fourth highest disease group, primarily due to a large increase in spending on PBS medications for Infectious diseases in that year.
The following interactive data visualisation (Figure 10) shows the change in rank in terms of overall spending and spending by broad area of expenditure between 2011–12 and 2020–21. Data used to create the visualisation is available to download from the data tables.
Figure 10: Ranking of spending on disease groups, by broad area of expenditure, current prices, 2011–12 to 2020–21
This bar chart shows a time series of health spending by disease from 2011-12 to 2020-2. From 2011–12 to 2014–15, Cardiovascular diseases ranked the highest. This shifted to Musculoskeletal disorders in 2015–16.

Spending by sex and age group
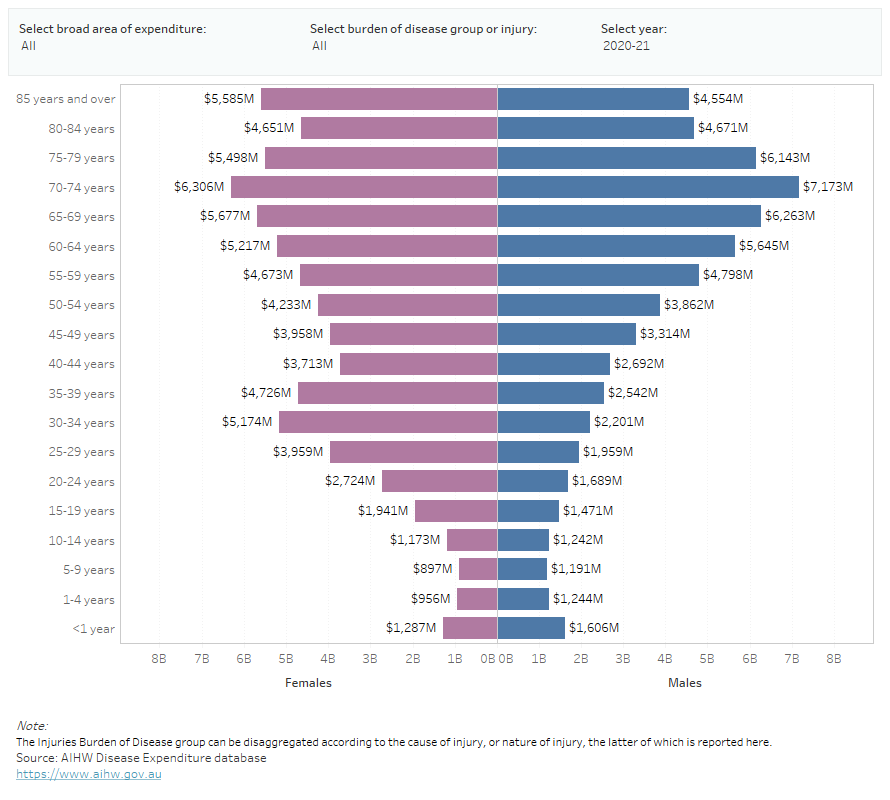
- Across the decade from 2011–12 to 2020–21 spending peaked for both males and females in the 65–74 age groups.
- For Infectious diseases, since 2018–19, the 1–4 year age group had the highest share of spending for both males and females.
- Within the hospital setting spending on cancers peaked between 60–74 year old males and females with clear increases in spending starting from around age 30–34 years onwards.
The following interactive data visualisation (Figure 11) shows the spending on disease groups by broad area of expenditure, age group and sex in current prices between 2011–12 and 2020–21. Data used to create the visualisation is available to download from the data tables.
Figure 11: Spending on disease groups, by broad area of expenditure, age group and sex, current prices, 2011–12 to 2020–21 ($ million)
This butterfly chart shows spending for both males and females increasing with age across most disease groups across the decade 2011–12 to 2020–21.

Spending by area of expenditure
- Spending on Infectious diseases across the decade from 2011–12 to 2020–21 has shown the most variation. The impact of COVID–19, resulted in an increase in spending in 2019–20 and 2020–21 especially in the area of pathology and non-admitted services in public hospitals. Earlier in the decade, in 2016–17, there was an increase in spending of medicines on the PBS used to treat infectious diseases in that year, namely the inclusion of ledipasvir+sofosbuvir, which is primarily used to treat hepatitis C.
- Across the decade from 2011–12 to 2020–21 for Musculoskeletal disorders the highest share of spending was through private hospitals with an increasing share through public admitted patients.
- In recent years there was a steady increase in the amount spent in the public hospital admitted setting for treating injuries.
- Over the past five years, since 2016–17, there was an increased share and amount spent to treat neurological conditions with PBS medications.
The following interactive data visualisation (Figure 12) shows the spending on disease groups by broad area of expenditure in current prices between 2011–12 and 2020–21. Data used to create the visualisation is available to download from the data tables.
Figure 12: Spending on disease groups, by area of expenditure, current prices, 2011–12 to 2020–21 ($ million)
This stacked bar chart shows the proportion of spending for each disease group that can be attributed to different areas of spending between 2011–12 and 2020–21.


