Specialist Homelessness Services: feature analysis:
People who received specialist homelessness services and alcohol and other drug treatment services who have died
Web article
Last updated:
Topic: Homelessness services
Citation
AIHW (Australian Institute of Health and Welfare) (2026) People who received specialist homelessness services and alcohol and other drug treatment services who have died, AIHW, Australian Government, accessed 27 July 2026.
This article is part of Specialist Homelessness Services: feature analysis
Clients
Outcomes
- Children with a history of specialist homelessness services support who have died
- People receiving specialist homelessness services support in the last year of life
- People who received specialist homelessness services and alcohol and other drug treatment services who have died This page
- People with a history of specialist homelessness services support who have died
People experiencing housing insecurity (including homelessness) and those receiving alcohol and other drug treatment services (AODTS) in Australia are particularly vulnerable to preventable disease and premature death (AIHW 2025a, 2025b, 2025c, 2025d; Flatau et al. 2021).
The characteristics of people who received both specialist homelessness services (SHS) and AOD treatment services and died throughout the study period 2012–13 to 2022–23 in Australia are detailed in this article.
Understanding the patterns, trends and causes of deaths among this group may highlight differences in health outcomes and inform prevention services, and improvements to policy and service design.
Analyses presented in this article are based on data from the NACS linked data set using the Specialist Homelessness Services Collection (SHSC), the Alcohol and Other Drug Treatment Services National Minimum Data Set (AODTS NMDS) and the National Death Index (NDI).
Data in this report will not match other reports produced by the AIHW about deaths in Australia including People with a history of specialist homelessness services support who have died and People who received specialist alcohol and other drug treatment services and died, due to different methodology. For more information see Technical notes.
For help or support
The AIHW respectfully acknowledges the people who have died who are described in this article.
The material presented below contains suicide and alcohol and other drug related data. Support is available via the following:
- Crisis and support services for a comprehensive list of organisations providing support.
- If you have any concerns about your own or someone else’s alcohol or drug use you can discuss this with your local General Practitioner or contact the National Alcohol and Other Drug Hotline on 1800 250 015 or a support and treatment centre.
- Ask Izzy for connections to support services.
Key findings
Over the study period 2012–23, around 64,900 people died who received either SHS, AODTS or both. Of these, around,
- 25,900 received AODTS only
- 27,300 people received SHS only
- 11,800 people received both SHS and AODTS.
Of the 11,800 people who received both SHS and AODTS who died, around:
- 2 in 3 (68%) were male
- 3 in 4 (74%) had a history of experiencing homelessness
- over half (52%) had a history of injecting drug use
- almost 2 in 5 (37%) had been treated for alcohol only throughout their treatment history.
Over the study period 2012–23:
- Median age at death was younger among people who received both SHS and AODTS (46 years) compared with AODTS-only clients (54 years) and SHS-only clients (60 years).
- Around 3 in 10 (29% or 11,200) deaths in people aged 25–40 in Australia had received either SHS, AODTS or both prior to death at some point since July 2012.
- Suicide, accidental poisoning and land transport accidents were the leading causes of death for people aged under 35 who received SHS, AODTS or both.
In 2022–23,
- People who received either SHS, AODTS or both who died, accounted for around 1 in 4 (24% or 186,000) potential years of life lost (PYLL) nationally.
- People who received both SHS and AODTS support who died, on average, lost more potential years of life per death (27 PYLL) than AODTS-only clients (22 PYLL), SHS-only clients (18 PYLL) and non-SHS AODTS clients (12 PYLL).
- Over 3 in 5 (63% or 1,300) deaths among people who received both SHS and AODTS were potentially avoidable – over 3 potentially avoidable deaths per day.
Defining client groups
The following client groups described in this report are presented below.
People who received both SHS and AODTS who have died (referred to as matched cohort in data tables) are people aged 10 years and older at the time of death who received both SHS and AODTS at any time throughout the study period of 2012–13 and 2022–23 and died between 1 July 2012 and 30 June 2023. Throughout this article this group is referred to as ‘People who received both SHS and AODTS who died’ or ‘SHS and AODTS clients’.
SHS-only clients are people aged 10 years and older at the time of death who received SHS at any time between 2012–13 and 2022–23 and died between 1 July 2012 and 30 June 2023.
AODTS-only clients are people aged 10 years and older who received AODTS at any time between 2012–13 and 2022–23 and died between 1 July 2012 and 30 June 2023.
Non SHS AODTS clients (referred to as neither AODTS or SHS in data tables) are people who did not receive SHS or AODTS between 2012–13 and 2022–23 and died between 1 July 2012 and 30 June 2023.
This population may include people who received SHS and/or AODTS prior to 2012–13, also people who may have received SHS and/or AODTS-equivalent services outside the publicly funded SHS and AODTS system, either prior to or within the study period.
Additionally, this population may also include people who experienced homelessness or alcohol and other drug use but did not receive services and also, people who received AODTS for someone else’s alcohol and/or other drug use.
Analysis coverage for people who received SHS and AODTS who have died
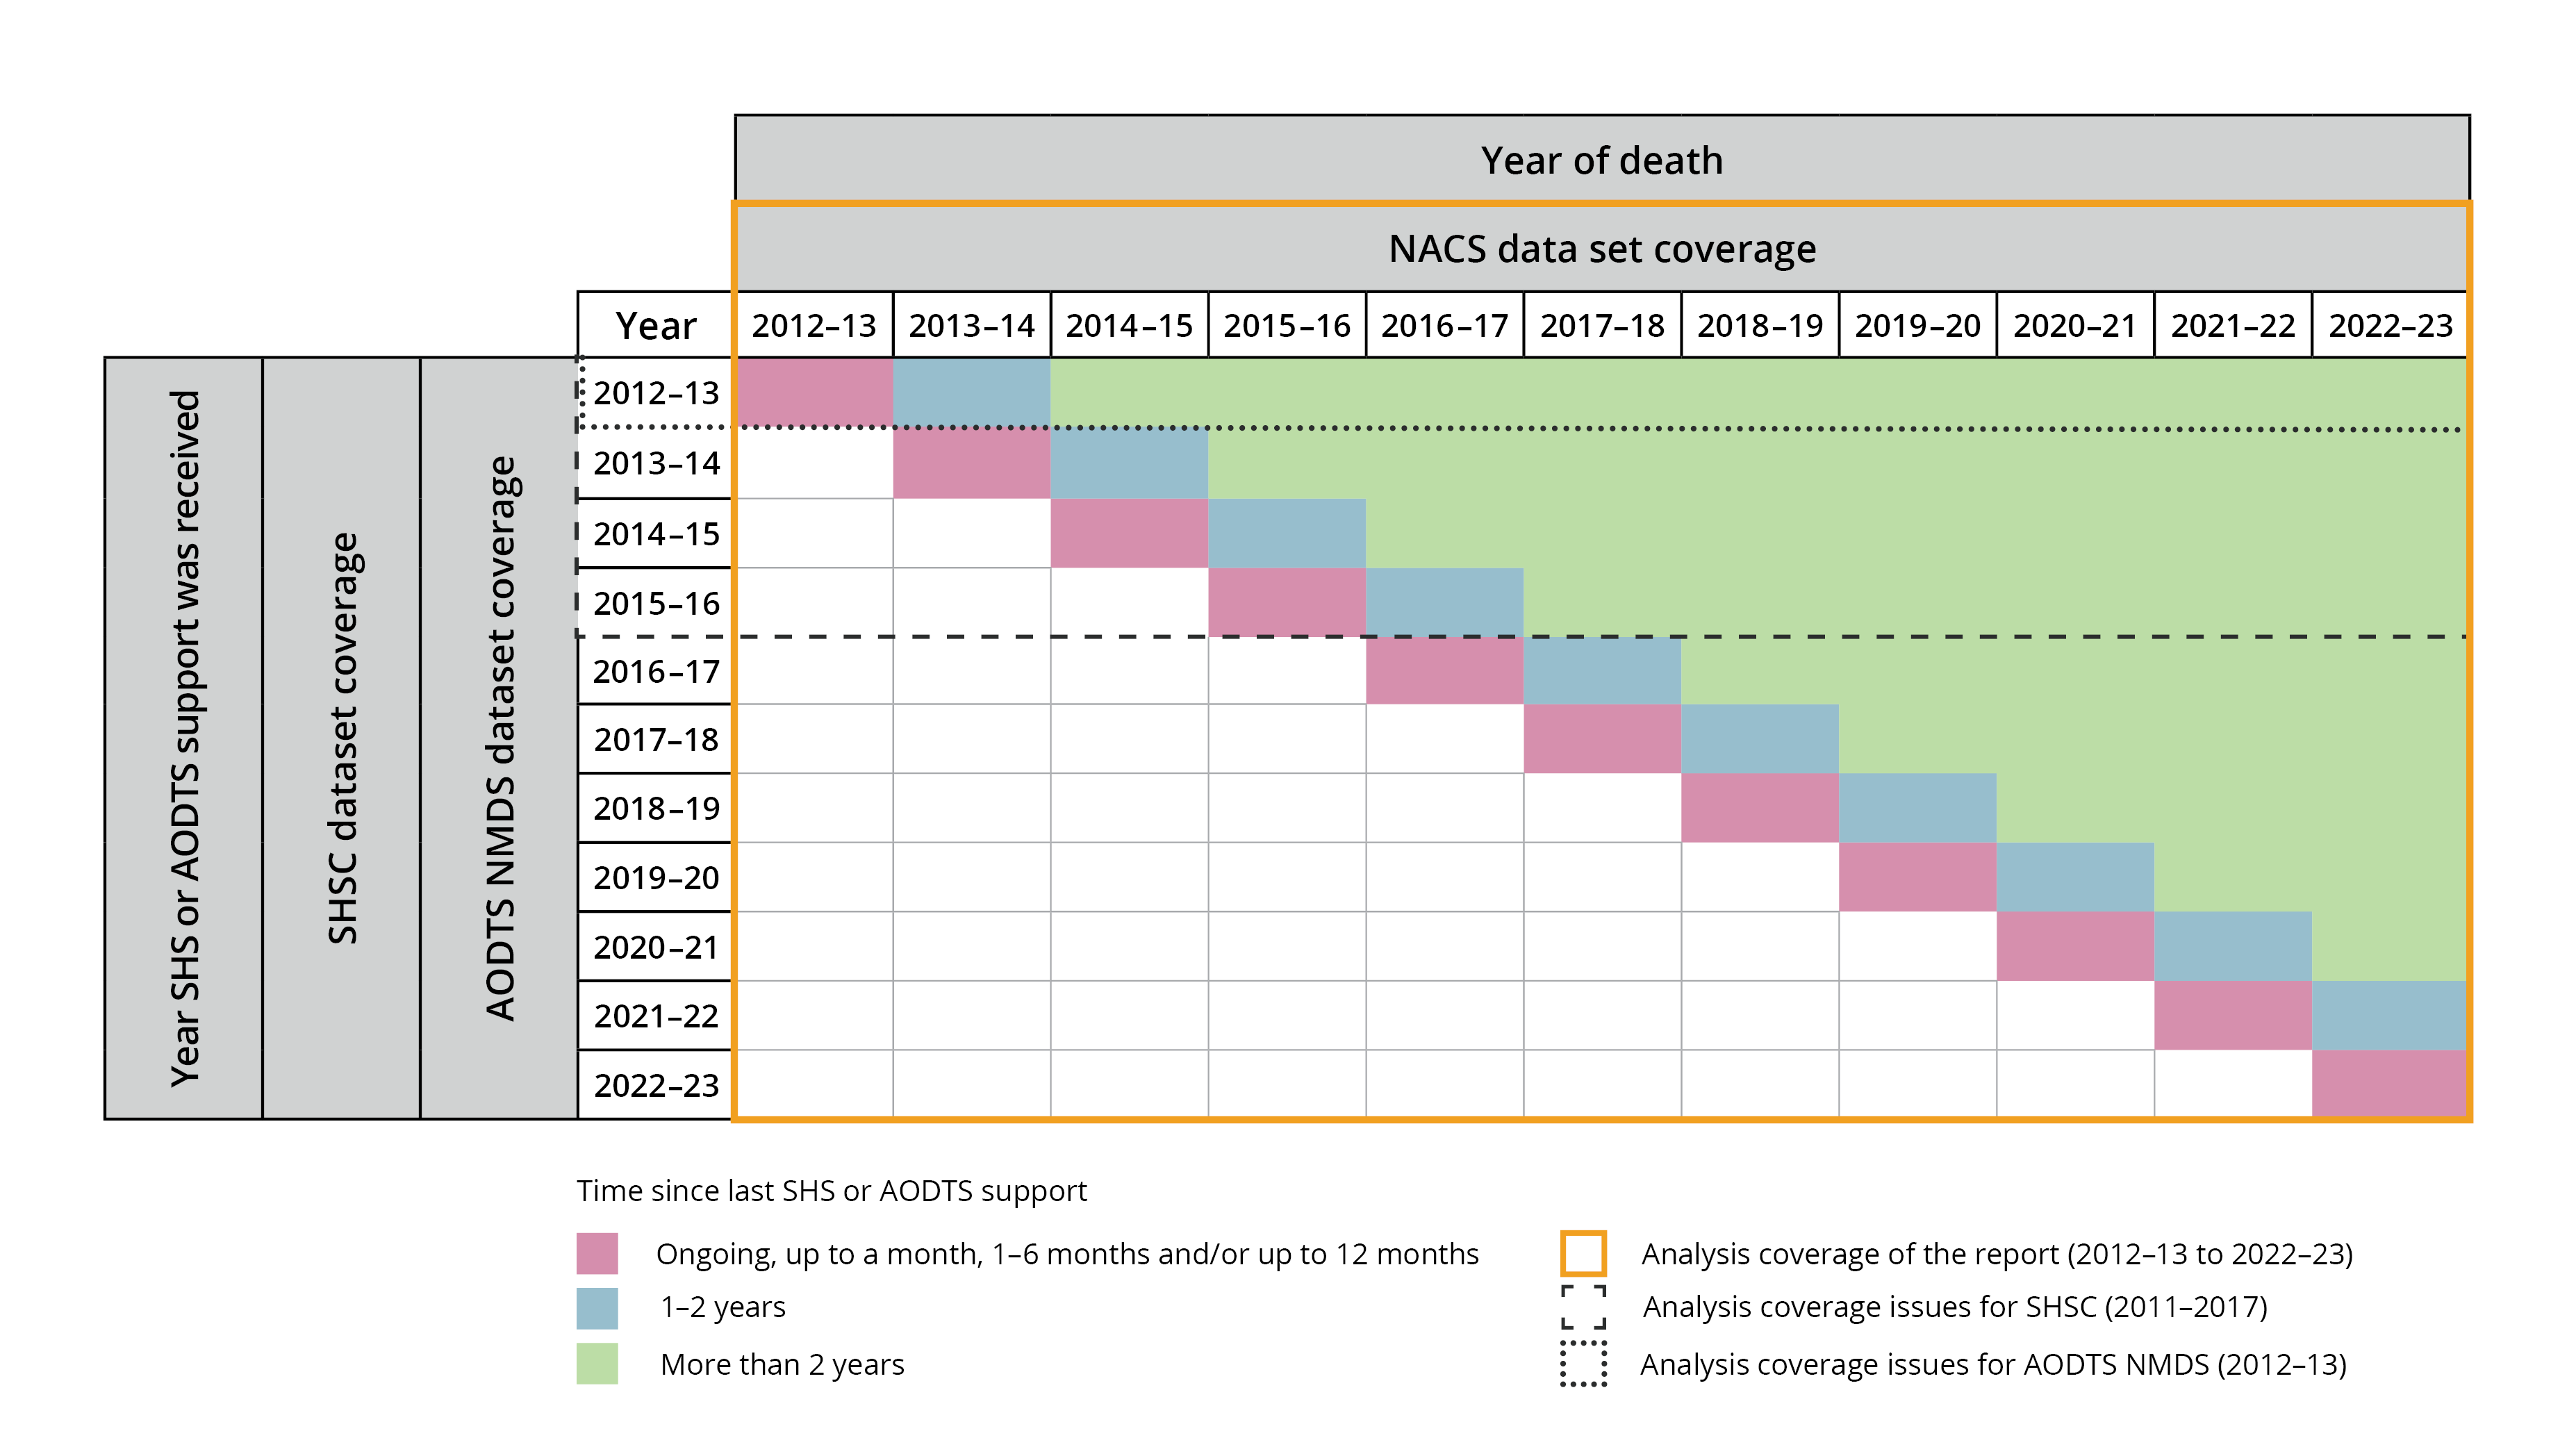
Analysis coverage for this report using the Specialist Homelessness Services Collection (SHSC) and the Alcohol and Other Drug Treatment Services National Minimum Data Set (AODTS NMDS) is limited from 2012–13 to 2022–23 as illustrated in Figure 1. Two important scope limitations are:
- SHS data are limited to people aged 10 and over at the time of death to be consistent with the scope of the AODTS NMDS data. More specifically, an SHS client may have been aged less than 10 when they received support, however, must have been aged 10 or over at some point throughout the study period to be in-scope to potentially receive AODTS.
- AODTS data are limited to people receiving services for their own alcohol and/or drug use.
For more information on the NACS, see SHS feature analysis Technical notes and AODTS feature analysis Technical notes.
Data coverage for the time since last support category ‘people who died more than 2 years since receiving SHS and/or AODTS is limited in this report. For example:
- the number of people who died in 2014–15 more than 2 years since their last SHS or AODTS support includes people who could have last received support in 2012–13 or 2013–14 (a 2-year period)
- the number of people who died in 2022–23 more than 2 years since their last SHS or AODTS support includes people who could have last received support at any time between 2012–13 and 2020–21 (a 9-year period).
An illustration of these coverage issues is provided below (Figure 1). No attempt has been made to correct for the varied amount of time people could have received SHS and/or AODTS support.
Figure 1: Analysis coverage of deaths among people who received either SHS, AODTS, or both
At the time of analysis, the cause of death information included in the National Death Index database was considered final for deaths registered prior to 2021, revised for deaths registered in 2021, and preliminary for deaths registered in 2022 and 2023. Preliminary data are subject to further revision.
Time since last support
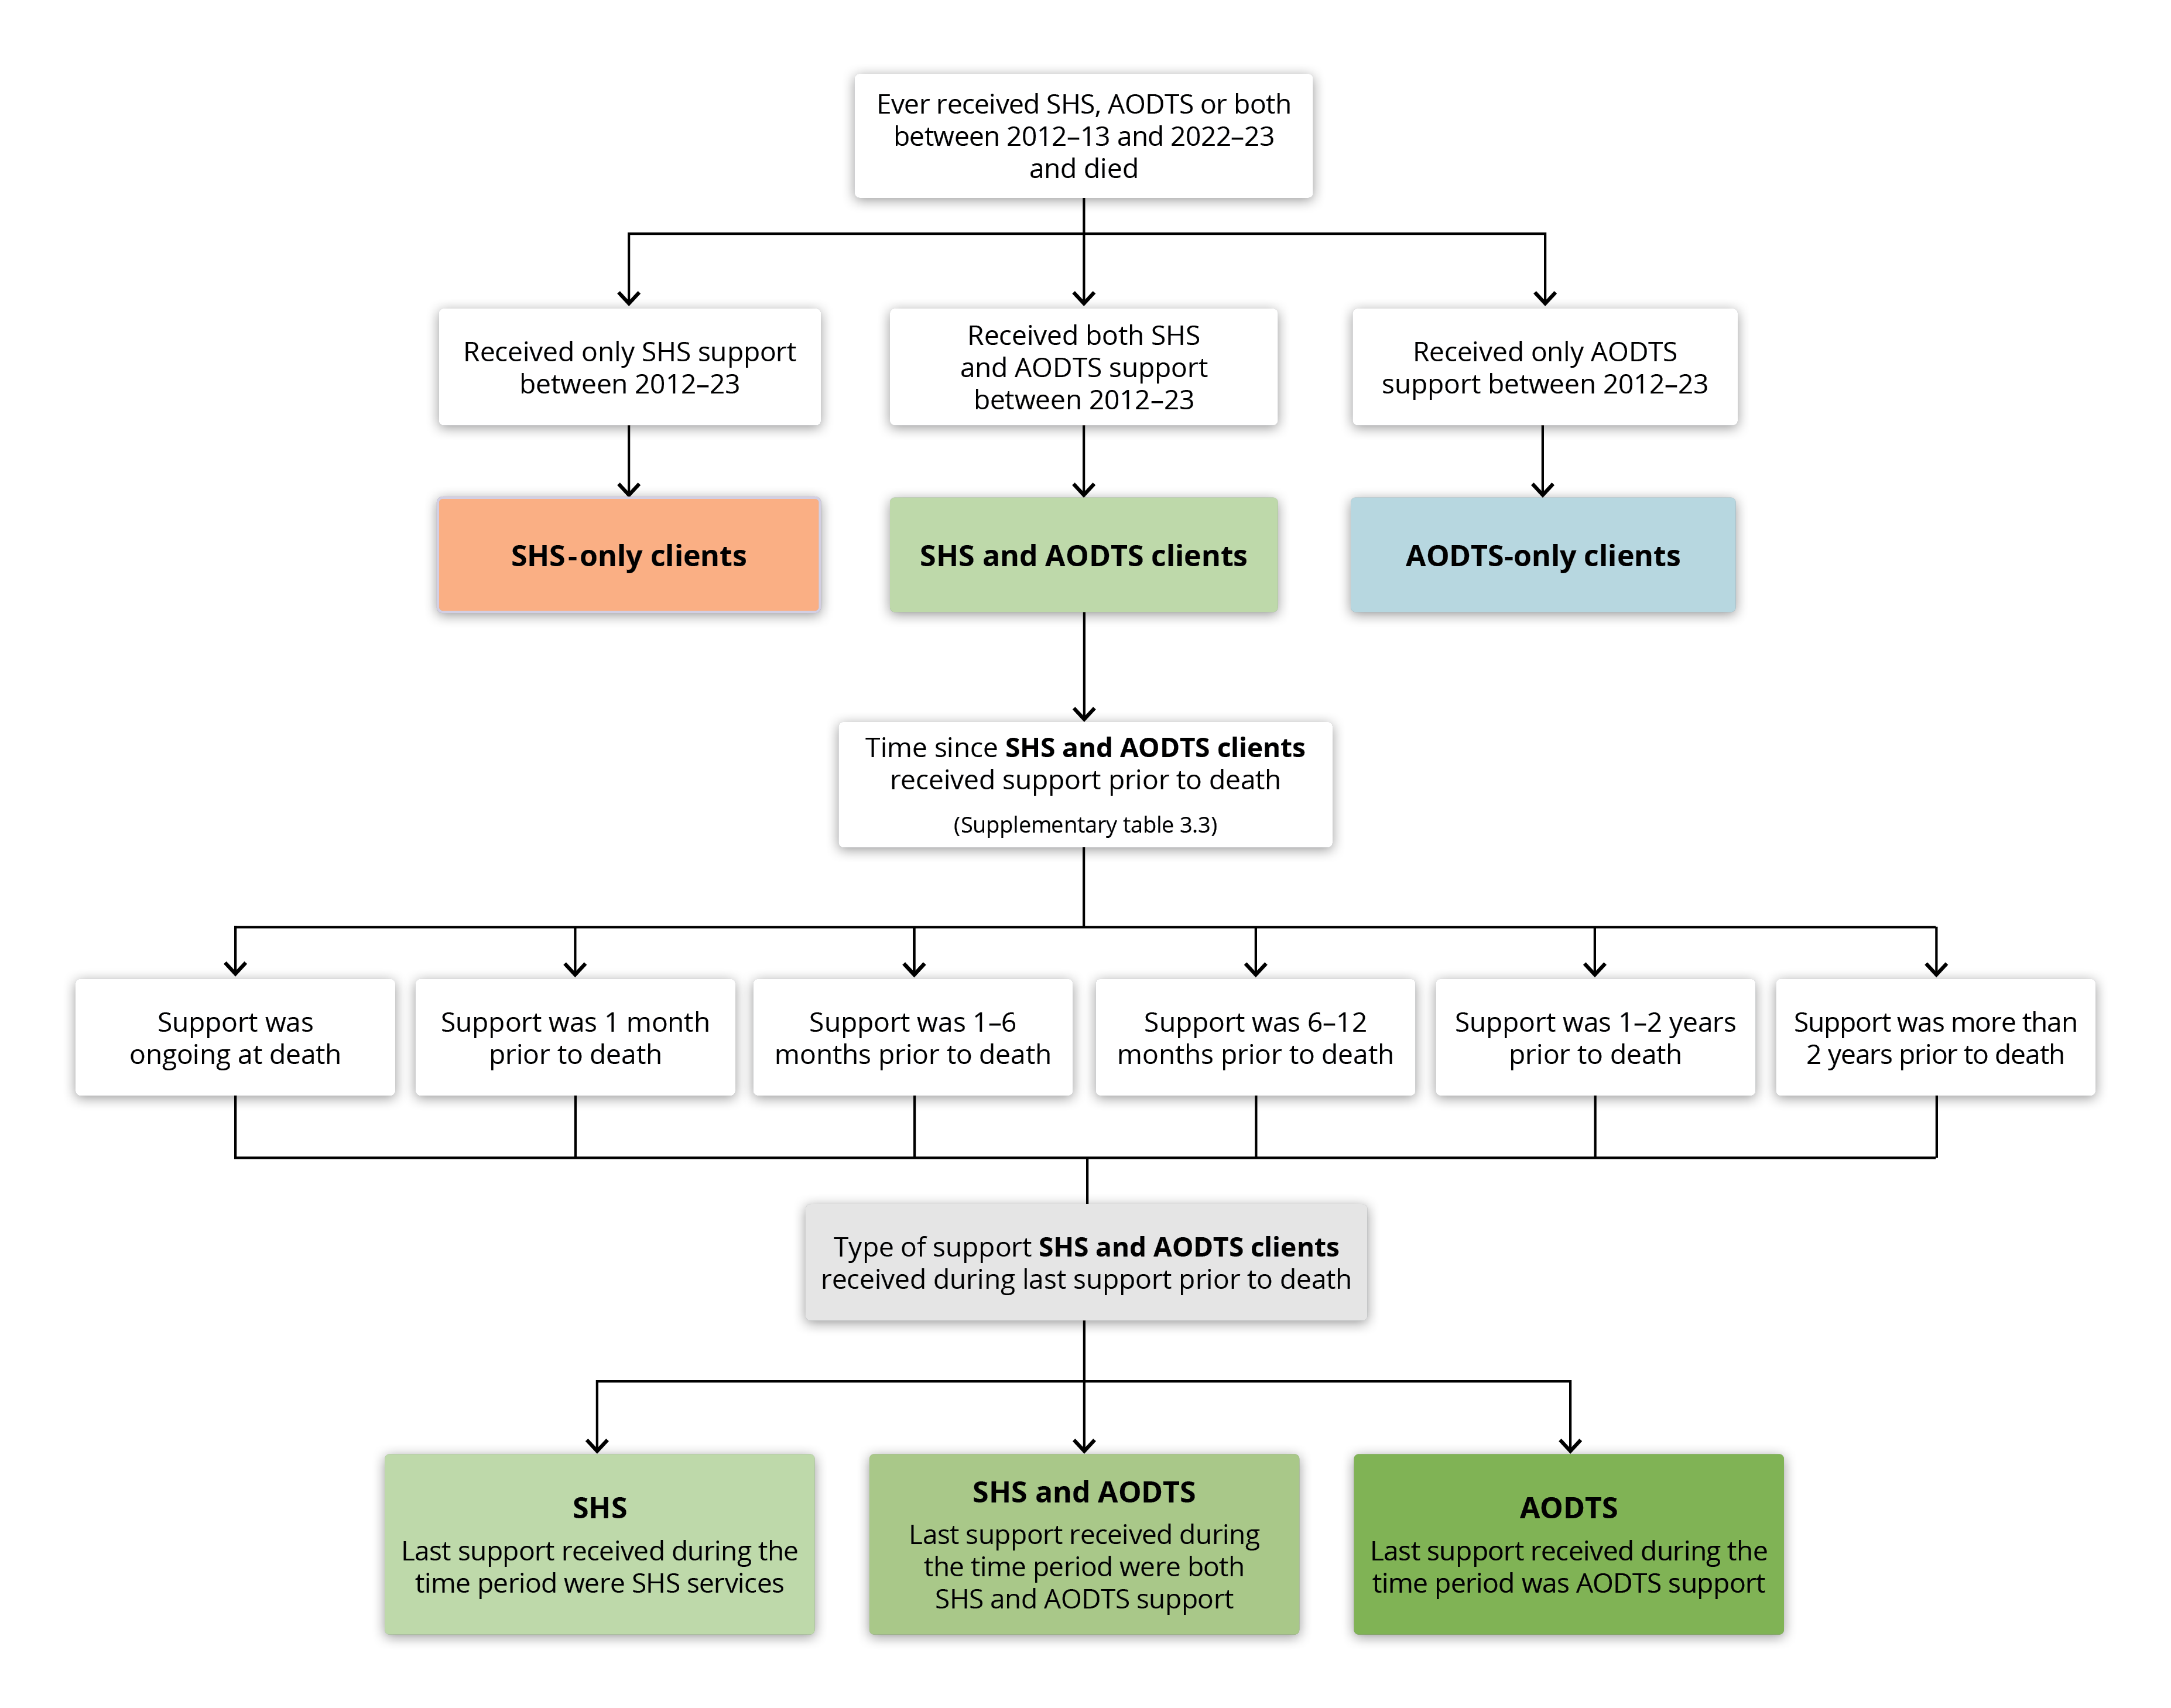
The number of deaths and median age of death among client groups (SHS and AODTS clients, SHS-only clients and AODTS-only clients) are presented in this article by the amount of time since support was last received: Ongoing, up to a month, 1–6 months, 6–12 months, 1–2 years and more than 2 years. Time since last support is determined based on whichever service was last received (either SHS, AODTS or both) in all tables except Supplementary Table 3.3.
In Supplementary Table 3.3, time since last support for SHS and AODTS clients is determined based on the specific service(s) (either SHS, AODTS or both) received closest to death (See Figure 2 for methodology). For example:
- If an SHS and AODTS client was in ongoing SHS support at the time of death and their last AODTS episode was not ongoing at the time of death, they will be included in the 'Matched cohort: SHS: ongoing' category.
- If an SHS and AODTS client's last support from SHS agencies was 7 months prior to death and their last support from AODTS agencies was 8 months prior to death, they will be included in the 'Matched cohort: AODTS and SHS: 6-12 months' category.
- If an SHS and AODTS client's last support from both SHS and AODTS agencies was more than 2 years prior to death, they will be included in the 'Matched cohort: AODTS and SHS: More than 2 years’ category.
No clients in the matched cohort can be in the 'AODTS: more than 2 years' or in the 'SHS: more than 2 years' categories because each client is reported in only one category. As per the third example above, if a client last received support from both SHS or AODTS agencies more than 2 years prior to death, they will be included in the 'Matched cohort: AODTS and SHS: More than 2 years' category.
Figure 2: Time since last support among people who received SHS and AODTS
People who received SHS and AODTS who have died
Around 11,800 people who received both SHS and AODTS died between 2012–23; accounting for around 1 in 20 (5.2%) people who received both SHS and AODTS over the study period.
Around 2 in 3 (68%) people who received both SHS and AODTS who died were male.
Around 1.9 million people aged 10 and over were in scope for this study having received SHS and/or AODTS support for their own alcohol or drug use throughout the period 2012–23. Of these, around 64,900 people died (Table 1):
- 25,900 had received AODTS only (AODTS-only clients)
- 27,300 had received SHS only (SHS-only clients)
- 11,800 had received both SHS and AODTS (SHS and AODTS clients).
Among all client groups, males accounted for a larger proportion of deaths than females. Males accounted for around 3 in 4 (74%) deaths in AODTS-only clients, over half (55%) of deaths in SHS-only clients and around 2 in 3 (68%) deaths in SHS and AODTS clients (Supplementary Table 3.2).
Over the study period, the crude mortality rate among SHS and AODTS clients was 64 deaths per 10,000 person-years; 1.6 times SHS-only clients (39), but lower than AODTS-only clients (79) (Table 1).
Of the 11,800 SHS and AODTS clients who died, most (88% or 10,300 people) had a history of receiving both services either at the same time or within any 2-year period (Table 1). SHS and AODTS clients with a history of ever receiving both SHS and AODTS at the same time had the highest mortality rate (74 per 10,000 person-years); almost 2 times those with a history of receiving services more than 2 years apart (38) (Table 1).
Client group | Total clients | Deaths | Mortality rate (per 10,000 person years) |
|---|---|---|---|
AODTS-only clients | 559,083 | 25,867 | 79.5 |
SHS-only clients | 1,112,523 | 27,277 | 39.3 |
SHS and AODTS clients(a) | 229,004 | 11,803 | 64.2 |
Ever received SHS and AODTS support at the same time(b) | 84,429 | 5,153 | 74.2 |
Ever received SHS and/or AODTS support within any 2-year period(c) | 98,772 | 5,178 | 68.4 |
SHS and/or AODTS support always received 2 years or more between services(d) | 45,803 | 1,472 | 38.0 |
Source: Supplementary Table 3.1
(a) Total SHS and AODTS clients, that is, the sum of clients (b), (c) and (d). For SHS and AODTS clients, the timing of the support received reflects a client's experience across the entire study period and does not necessarily reflect the support received immediately prior to death.
Time since last support
Over the study period, a greater proportion of deaths in SHS and AODTS clients occurred within one year of receiving support (61% or 7,200 deaths), compared with SHS-only clients (31% or 8,500 deaths) and AODTS-only clients (40% or 10,300 deaths) (Supplementary Table 3.3).
A greater proportion of deaths in SHS and AODTS clients occurred while a period of support from either SHS, AODTS or both services was ongoing at the time of death (17% or 2,000 deaths) compared with SHS-only clients (6.5% or 1,800 deaths) and AODTS-only clients (6.7% or 1,700 deaths) (Supplementary Table 3.3).
Of the 2,000 SHS and AODTS clients who died while support was ongoing, around (Supplementary Table 3.3, see Definitions and important data quality notes):
- 1 in 12 (8.6% or 175) were receiving both SHS and AODTS when they died
- 1 in 2 (52% or 1,100) were receiving only SHS when they died
- 2 in 5 (40% or 820) were receiving only AODTS when they died.
Age at death
Over the study period, around 3 in 10 (29% or 11,200) deaths in people aged 25–40 in Australia had received either SHS, AODTS or both prior to death at some point since July 2012.
Median age at death was younger among people who received both SHS and AODTS (46 years) compared with SHS-only (60 years) and AODTS-only clients (54 years).
Over the study period 2012–23, the median age at death among SHS and AODTS clients was 46 years; younger than AODTS-only clients (54 years) and SHS-only clients (60 years) (Supplementary Table 3.3). Among SHS and AODTS clients who died, median age at death was younger among females (45 years) than males (46 years). By contrast, median age at death was younger in male AODTS-only clients (53 for males; 56 for females) and similar among SHS-only clients (60 for both males and females).
Over the study period, the proportion of SHS and AODTS clients who died aged 65 and older (5.7%) was lower than SHS-only clients (39%), AODTS-only clients (25%), and much lower than people who did not receive SHS or AODTS support (non SHS or AODTS clients) (85%) (Supplementary Table 3.2, Figure 3).
Over the study period, around 3 in 10 (29% or 11,200) deaths in people aged 25–40 in Australia had received either SHS, AODTS or both prior to death and within the study period. A similar proportion of all deaths in males aged 25–40 (29% or 7,600) and females aged 25–40 (27% or 3,600) in Australia had received either SHS, AODTS or both prior to death (Supplementary Table 3.2).
Figure 3: Deaths (per cent), by age and client group, 2012–2023
The stacked bar chart shows 30% of total deaths at age 37 had received support from SHS, AODTS, or both prior to death.

Source: Supplementary Table 3.2.
Time since last support
Over the study period 2012–23, the median age at death was younger among SHS and AODTS clients receiving ongoing support when they died (44 years) compared with AODTS-only clients (48 years) and SHS-only clients (54 years) receiving ongoing support when they died (Supplementary Table 3.3).
Of the 2,000 SHS and AODTS clients who died while support was ongoing, median age at death varied based on which service was received closest to death (either SHS, AODTS or both):
- 40 years among those receiving both ongoing SHS and AODTS when they died
- 44 years for those receiving only ongoing SHS when they died
- 44 years for those receiving only ongoing AODTS when they died.
Potential years of life lost
In 2022–23, people who received either SHS, AODTS or both who died, accounted for around 1 in 4 (24% or 186,000) potential years of life lost (PYLL) nationally.
In 2022–23, people who received both SHS and AODTS support who died, on average, lost more potential years of life per death (27 PYLL) than AODTS-only clients (22 PYLL), SHS-only clients (18 PYLL) and non-SHS AODTS clients (12 PYLL).
Potential years of life lost (PYLL) is an estimate of the number of years longer a person might have lived had they not died prematurely. For example, dying before the age of 75 is considered premature; therefore, a person who died aged 55 would have lost 20 years of potential life. For more information, see Deaths in Australia, Age at death. Potential years of life lost is only applicable to people aged 10–74 years in this report and the study period is limited to 2018–19 to 2022–23. For more information, see Technical notes.
In 2022–23, around 24% (186,000 PYLL) of all the PYLL in Australia were among people who had received either SHS and/or AODTS, an increase from 19% in 2018–19 (Supplementary Table 3.4).
In 2022–23, SHS and AODTS clients had a higher average PYLL per death (27 PYLL) than AODTS-only clients (22 PYLL), SHS-only clients (18 PYLL) and non-SHS AODTS clients (12 PYLL); consistent with the younger median age at death (46 years) among SHS and AODTS clients (Supplementary Table 3.3).
In 2022–23, SHS and AODTS clients who died accounted for around 1 in 15 (6.9% or 53,700) PYLL nationally (Supplementary Table 3.4). Of the 53,700 PYLL (Supplementary Table 3.4):
- around 2 in 3 (65% or 35,100) PYLL were among males
- over half (54% or 28,900) of PYLL were among those who received both SHS and AODTS within 1 year prior to death.
In 2022–23, males who received both SHS and AODTS who died accounted for 1 in 14 (7.1%) PYLL among all males, higher than for females who accounted for around 1 in 16 (6.4%) PYLL among all females (Supplementary Table 3.4).
Time since last support
In 2022–23, SHS and AODTS clients that received support up to 6 months prior to death had higher average PYLL (29–31 PYLL) than those who received support beyond 6 months prior to death (24–28 PYLL) (Supplementary Table 3.4).
Principal drug of concern
Over the study period 2012–23, among deaths in people who received both SHS and AODTS, almost 2 in 5 (37% or 4,400) were treated for alcohol only throughout their specialist AOD treatment history.
A principal drug of concern (PDOC) refers to the main substance which an AODTS client stated led them to receive treatment. A person may have multiple treatment episodes over their lifetime and may receive treatment for different PDOCs in each treatment episode. For example, a person may receive treatment for alcohol use in one treatment episode, followed by another treatment episode for heroin use. Some people may receive treatment for the same PDOC each time they receive treatment (that is, each episode). These episodes could occur in the same year, or in different years. In the results presented here, if a client is treated for two different PDOCs, they may be counted more than once. For example, a client treated for alcohol and heroin will be included in results for 'Alcohol and another drug' and 'Heroin and another drug'. See the AODTS NMDS Annual Reporting Technical notes for more information on how drugs of concern are classified.
The information presented below on PDOC includes all treatment episodes a client received for their own drug or alcohol use over the study period. That is, it presents a combination of all PDOCs a client has received treatment for, at any point between 1 July 2012 and 30 June 2023. This is because some drug use and drug combinations may be associated with a greater rate of death. To only include the PDOC a client received in their last treatment episode prior to death would mask any differences the combination of PDOCs may have on a person’s outcomes.
Due to the nature of this study, the service and PDOC history will not be as complete for those clients who died earlier in the reporting period, as those clients who died later in the reporting period. Similarly, the analysis here only presents a client’s PDOC history over the entire study period, which may mask changes over time for specific PDOC combinations.
The information below does not indicate whether a client’s PDOC was related to, caused by, or present in their death. These findings serve to highlight mortality among clients with different PDOC treatment histories, warranting its further analyses.
For more information on PDOC analysis used in this article see Technical notes.
Over the study period 2012–23, among the 11,800 SHS and AODTS clients who died (Figure 4):
- almost 2 in 5 (37% or 4,400) were treated for alcohol only throughout their specialist AOD treatment service history.
- around 1 in 8 (12% or 1,400) were treated for alcohol and another drug throughout their specialist AOD treatment service history.
SHS and AODTS clients who died were more likely to have received specialist AOD treatment for multiple drugs of concern during their treatment history than AODTS-only clients (Supplementary table 3.7 and Figure 4). Over the study period, 1 in 9 (11% or 1,300) SHS and AODTS clients who died were treated for 3 or more PDOC(s) throughout their treatment history; higher than AODTS-only clients (2.3% or 600).
Female SHS and AODTS clients who were treated for pharmaceuticals only (7.0%) or pharmaceuticals and another drug (6.4%) accounted for a greater proportion of deaths than their male counterparts (5.0% and 5.3% respectively) (Supplementary table 3.7).
Over the study period, a greater proportion of deaths among SHS and AODTS clients occurred in those who received specialist AOD treatment services for heroin only or pharmaceuticals only compared with other PDOC(s) and combinations of PDOC(s) (Figure 4, Supplementary table 3.7).
- Among the 5,200 SHS and AODTS clients who received specialist AOD treatment services for heroin only, around 1 in 9 (11% or 590) died; a higher proportion than AODTS-only clients (7.8%).
- Among the total 6,000 SHS and AODTS clients who received specialist AOD treatment services for pharmaceuticals only, around 11% or 660 people died; a higher proportion than AODTS-only clients (9.9%).
Figure 4: Deaths among people who received SHS and/or AODTS, by principal drug of concern and sex, 2012–2023
The horizontal bar chart shows among deaths in SHS and AODTS clients, most (4,373) had received AODTS for the treatment of alcohol only.

Source: Supplementary Table 3.7.
Additional specific vulnerabilities – history of homelessness or injecting drug use
Over the study period 2012–23, of the 11,800 people who received both SHS and AODTS who died, around 3 in 4 (74%) had a history of experiencing homelessness and over half (52%) had a history of injecting drug use.
Over the study period 2012–23, of the 11,800 SHS and AODTS clients who died (Supplementary Table 3.5):
- Around 3 in 4 (74% or 8,800) had a history of homelessness; a higher proportion than SHS-only clients (48%).
- Over half (52% or 6,100) had a history of injecting drug use; a higher proportion than AODTS-only clients (27%).
Median age at death among SHS and AODTS clients with a history of homelessness was younger (45 years) than SHS-only clients with a history of homelessness (56 years). Similarly, median age at death among SHS and AODTS clients with a history of injecting drug use was younger (44 years) than AODTS-only clients (47 years) (Supplementary Table 3.5).
Among SHS and AODTS clients, males were more likely to have a history of homelessness (78%) and history of injecting drug use (54%) compared with females (67% and 48%, respectively) (Supplementary Table 3.5). However, median age at death was younger among females with a history of homelessness (43 years) and history of injecting drug use (43 years) compared with males (46 years and 45 years respectively) (Supplementary Table 3.5).
Underlying cause of death
Over the study period 2012–23, suicide, accidental poisoning and land transport accidents were the leading causes of death for people aged under 35 who received SHS, AODTS or both.
For information about how causes of death are classified, see Technical notes. Accidental poisoning is caused by exposure to a substance in an amount that unintentionally causes death, which includes accidental drug overdose. In 2022–23, most deaths from accidental poisoning in Australia were caused by other and unspecified drugs and biological substances, followed by antiepileptics, sedatives and psychotropics, and then narcotics, opioids and hallucinogens. For information on accidental poisoning see Injury in Australia: Accidental poisoning. Information on which specific substance was associated with accidental poisoning deaths in this article is not specified.
Over the study period 2012–23, among all client groups, suicide and accidental poisoning were more common underlying causes of death among younger clients while liver disease and coronary heart disease were more common among older clients (Supplementary Table 3.6, Figure 5).
Among people aged 18–64 who had received SHS, AODTS or both who died, around 1 in 7 (14% or 6,300) had died from suicide and around 1 in 6 (16% or 7,300) had died from accidental poisoning (Supplementary Table 3.6).
Suicide
Over the study period, around 26,600 people aged 18–64 in Australia died from suicide. Of these, almost 1 in 4 (24% or 6,300) deaths were among people who received support from SHS, AODTS, or both prior to death and within the study period; somewhat higher among females who died from suicide (28% or 1,800 deaths) than males (23% or 4,500 deaths) (Supplementary Table 3.6).
Among SHS and AODTS clients aged 18–64, suicide accounted for around 1 in 7 deaths (14% or 1,600 deaths); similar among males (14% or 1,100 deaths) and females (14% or 490 deaths). A higher proportion of AODTS-only clients aged 18–64 died from suicide (15% or 3,000 deaths) than SHS and AODTS clients (14% or 1,600 deaths) and SHS-only clients (11% or 1,800 deaths).
Accidental poisoning
Over the study period, around 13,700 people aged 18–64 in Australia died from accidental poisoning. Of these, over half (53% or 7,300) of deaths were among people who received support from SHS, AODTS, or both prior to death and within the study period; a similar proportion among males (54% or 5,100 deaths) and females (52% or 2,200 deaths).
Among SHS and AODTS clients aged 18–64, accidental poisoning accounted for around a quarter (25% or 2,800) of deaths; higher than AODTS-only clients (16% or 3,000) and SHS-only clients (9.1% or 1,500) aged 18–64 who died from accidental poisoning.
Over the study period, most deaths in SHS and AODTS clients were aged 35–54 (Supplementary Table 3.2). Among SHS and AODTS clients who died aged 35–44 years, a greater proportion of clients died from accidental poisoning (34% or 1,100) than among AODTS-only clients (26% or 1,000) and SHS-only clients (17% or 465). However, a lower proportion of SHS and AODTS clients who died aged 35–44 years, died from suicide (15% or 455) than AODTS-only clients (21% or 840) and SHS-only clients (16% or 450).
Figure 5: Deaths among people who received SHS and/or AODTS, by selected causes of death, client group, sex and age, 2012–23
The bar chart shows accidental poisoning and suicide were more common underlying causes of deaths in younger age groups than older age groups across all client groups.

Note: Data are limited to the top 10 ranked causes of death in each client group and age group. See table 3.6 for further detail.
Source: Supplementary Table 3.6.
Potentially avoidable deaths
In 2022–23, over 3 in 5 (63% or 1,300) deaths among people who received both SHS and AODTS were potentially avoidable – over 3 potentially avoidable deaths per day.
Potentially avoidable deaths are deaths from conditions that could have been prevented or treated with timely and effective health care. Potentially avoidable deaths are classified using nationally agreed definitions based on cause of death for people aged under 75. For more information, see the Australian Health Performance Framework.
Note that potentially avoidable deaths contribute to but do not account for total potential years of life lost, the latter being a measure of all premature death (not just death that was potentially avoidable).
Potentially avoidable deaths are only applicable to people aged 10–74 years in this report and is also limited to 2018–19 to 2022–23. For more information, see Technical notes.
In 2022–23, over half (57% or 4,900) of deaths among people who received SHS, AODTS or both were potentially avoidable (Supplementary Table 3.8). Of the 4,900 potentially avoidable deaths, around:
- 1,800 deaths were among AODTS-only clients
- 1,900 deaths were among SHS-only clients
- 1,300 deaths were among SHS and AODTS clients.
The proportion of potentially avoidable deaths among SHS and AODTS clients (63%) was higher than among AODTS-only clients (54%), SHS-only clients (55%) and non-SHS or AODTS clients (46%) (Supplementary Table 3.8).
Time since last support
As time since last support increased, the proportion of potentially avoidable deaths among SHS and AODTS clients varied (Supplementary Table 3.8). Throughout 2018–19 to 2022–23, among SHS and AODTS clients who died:
- over 2 in 3 (69% or 900) deaths among those who received ongoing support were potentially avoidable
- over 2 in 3 (69% or 1,100) deaths among those who received support between 1–6 months prior to death were potentially avoidable
- 2 in 3 (66% or 690) deaths among those who received support between 6–12 months prior to death were potentially avoidable
- 3 in 5 (58% or 1,300) deaths among those who received support more than 2 years prior to death were potentially avoidable.
Throughout 2018–19 to 2022–23, the proportion of potentially avoidable deaths was higher among males than females who died while receiving ongoing SHS and specialist AOD treatment services (70% of males compared with 68% of females), within 1–6 months prior to death (71% of males compared with 66% of females) and more than 2 years prior to death (60% of males and 54% of females) (Supplementary Table 3.8).
Throughout 2018–19 to 2022–23, SHS and AODTS clients who died while receiving ongoing support had a higher proportion of potentially avoidable deaths (69% or 900) compared with SHS-only clients (61% or 475) and AODTS-only clients (61% or 510) receiving ongoing support. This pattern was similar among male and females (Supplementary Table 3.8).
Figure 6: Percentage of deaths that were potentially avoidable, by client status and time since last support, ages 10–74, 2018–19 to 2022–2023
This heat map shows people who received SHS and AODTS had a higher proportion of potentially avoidable deaths across all time since support categories compared with AODTS-only clients and SHS-only clients.

Source: Supplementary Table 3.8.
NACS dataset
The NACS linked dataset includes:
- National Death Index (NDI),
- Alcohol and Other Drug Treatment Services National Minimum Data Set (AODTS NMDS),
- Commonwealth funded health services (MBS and PBS), and the
- Specialist Homelessness Services Collection (SHSC).
See the Technical notes for more information about the linkage process and details of the dataset years included in the NACS.
Data presentation
Throughout this article:
- Values presented in the columns and rows of tables may not sum to the totals shown due to missing and not stated values, as well as rounding.
- Totals reported include missing and not stated values, unless otherwise noted.
- The percentages shown in the tables are calculated excluding the missing and not stated values, unless indicated otherwise.
- Percentage distributions may not sum to 100 due to rounding.
- The Australian Institute of Health and Welfare (AIHW) has strict confidentiality policies which have their basis in section 29 of the Australian Institute of Health and Welfare Act 1987 (AIHW Act) and the Privacy Act 1988 (Privacy Act). Data may be suppressed for either confidentiality reasons or where estimates are based on small numbers, resulting in low reliability. Information that results in attribute disclosure will also be suppressed.
Deaths data and statistics
Data for the number of deaths is sourced from the NACS linked dataset. Deaths in this report are presented by year of occurrence. In the version of the NDI database used in the NACS, data were considered final deaths registered prior to 2021, revised for deaths registered in 2021 and preliminary for deaths registered in 2022 and 2023. Preliminary data are subject to further revision.
The number of deaths in this report are not comparable to other AIHW publications, such as Deaths in Australia, due to:
- different data sources (National Death Index compared with the AIHW National Mortality Database)
- year of death occurrence compared with year of death registration.
More information on deaths data and statistics for the NACS linked dataset are available in the Technical notes.
Specialist homelessness services
Client counts
The number of clients presented in this report will not necessarily match totals presented in other reports. This is more marked for years prior to 2017–18, where SHSC data in other reports were imputed to account for agency non-response and invalid SLKs. Imputation was not required from 2018–19 due to the high rates of agency response and SLK validity. Imputation was not applied to the SHSC data for this project.
Sex
Sex is based on the sex reported to Medicare. If this was not available, the most frequently reported sex in the SHSC for a client was assigned; if there was not a dominant proportion, the client was based on the sex that was recorded for their most recent SHS activity. Sex was missing for some records; the sum of males and females may not add to the total.
Due to data quality issues as well as confidentiality concerns, those clients identifying as Sex = Other have been included in the ‘Female’ category.
AIHW (Australian Institute of Health and Welfare) (2025a) People who received specialist Alcohol and Other Drug Treatment Services in their last year of life, AIHW, Australian Government, accessed 05 January 2026.
AIHW (2025b) People with a history of specialist homelessness services support who have died, AIHW, Australian Government, accessed 05 January 2026.
AIHW (2025c) People receiving specialist homelessness services support in the last year of life, AIHW, Australian Government, accessed 05 January 2026.
AIHW (2025d) Burden of disease and injuries related to alcohol and other drugs, AIHW, Australian Government, accessed 05 January 2026.
Amendments
14 July 2026 – an error was found in the data presented about people who died by suicide and accidental poisoning. Total number of deaths and the proportion of SHS-AODTS clients were updated on 14 July 2026. The error was limited to the words on this web page