Injury in Australia:
Accidental poisoning
Web article
Last updated:
Topic: Injury
Citation
AIHW (Australian Institute of Health and Welfare) (2026) Accidental poisoning, AIHW, Australian Government, accessed 21 July 2026.
This article is part of Injury in Australia
Unintentional causes
Intentional causes
Definitions
This article describes accidental cases of poisoning resulting in hospitalisation or death. Intentional poisoning injuries are included under Self-harm injuries and suicide or Assault and homicide. Poisoning cases where intent cannot be determined are described in the article on Undetermined or other unintentional causes. As intent is often difficult to ascertain in cases of poisoning, a substantial number of hospitalisations and deaths related to poisoning are categorised as Undetermined intent.
Injury hospitalisations due to accidental poisoning mostly involve pharmaceutical substances as the harmful substance. In this article, we only describe the type of substance responsible for the accidental poisoning, without consideration for the means through which the substance was obtained (including regular prescriptions, over-the-counter medication, or illicitly obtained substances). We note however that the adverse side effects of correctly prescribed medication consumed at the correct dosage are not in the scope of this report.
For more information on the health impact of alcohol and other drugs, see the AIHW reports on Alcohol, tobacco and other drugs in Australia, and on Illicit use of drugs.
Hospitalised injury cases are described using ICD-10-AM. ICD-10-AM external cause codes define the following 10 categories for accidental poisoning:
- Non-opioid analgesics, antipyretics and antirheumatics, including (but not limited to) nonsteroidal anti-inflammatory drugs (NSAIDs)
- Antiepileptics, sedatives and psychotropics, including (but not limited to) antidepressants, psychostimulants and tranquilisers
- Narcotics, opioids and hallucinogens, including (but not limited to) opioids such as codeine, morphine and heroin
- Other drugs acting on the autonomic nervous system
- Other and unspecified drugs and biological substances, including pharmaceutical and biological substances not classified elsewhere, such as anaesthetics, antibiotics and other anti-infectives, hormones and their synthetic substitutes and antagonists, and others. This category is also used in mortality data (but not in hospitalisations data) to record cases of deaths caused by multi-drug toxicity
- Alcohol
- Organic solvents, including (but not limited to) petroleum and its derivatives, and including vapours from organic solvents
- Other gases and vapours, including (but not limited to) carbon monoxide and exhaust fumes
- Pesticides
- Other and unspecified noxious substances, including (but not limited to) chemicals not elsewhere classified such as paints or corrosive substances.
This report mostly refers to these 10 categories to describe the type of substance(s) responsible for cases of accidental poisoning injury hospitalisations or deaths. Some hospitalisation records include further detail of substances in the primary diagnosis codes. Where available, these are further described for selected substances of interest.
Substances involved in accidental poisoning
In 2024–25, other and unspecified drugs and biological substances, was the category most frequently related to accidental poisoning hospitalisations (Figure 1a). This was followed by antiepileptics, sedatives and psychotropics and narcotics and psychodysleptics.
Figure 1a: Injury hospitalisations due to accidental poisoning, by category of substance involved, 2024–25
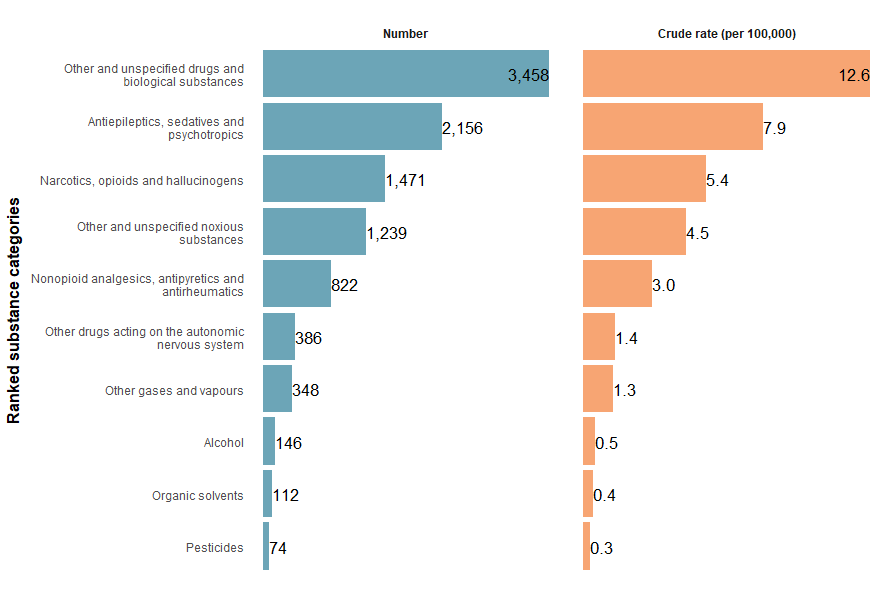
Sources: AIHW National Hospital Morbidity Database and ABS National, state and territory population.
In 2024–25, the specific types of substances most frequently recorded in accidental poisoning hospitalisations were agents primarily affecting the cardiovascular system, gamma hydroxybutyrate (GHB) and antidiabetics & insulin (Figure 1b).
Figure 1b: Injury hospitalisations due to accidental poisoning, by specific type of substance involved, 2024–25
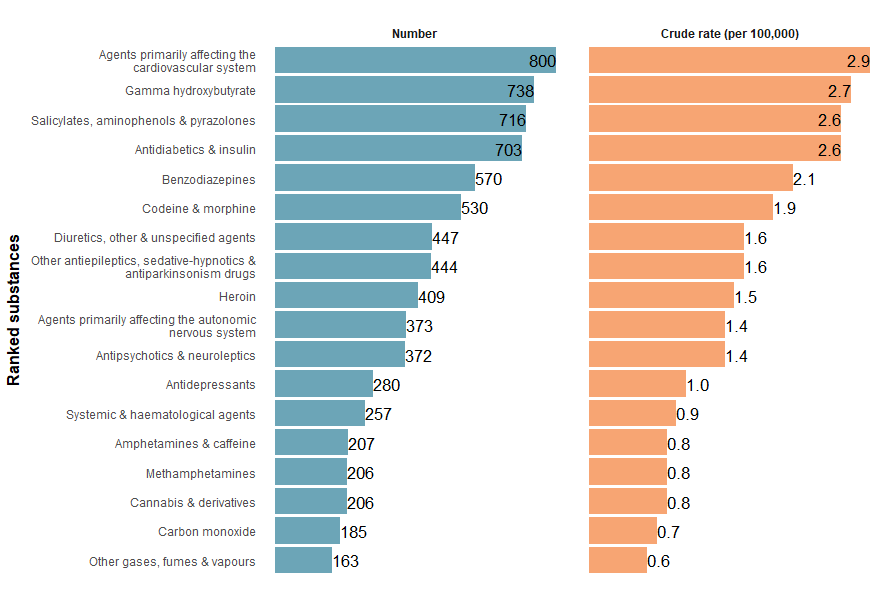
Sources: AIHW National Hospital Morbidity Database and ABS National, state and territory population.
In 2023–24, most accidental poisoning deaths were also caused by other and unspecified drugs and biological substances (Figure 2). However, the category’s scope differs between hospitalisations and deaths data: both include cases caused by drugs or biological substances not classified elsewhere, but mortality data also covers deaths from multiple substances. Because of this coding difference, contributions to this category can't be directly compared between hospitalisations and deaths .
Figure 2: Injury deaths due to accidental poisoning, by category of substance involved, 2023–24
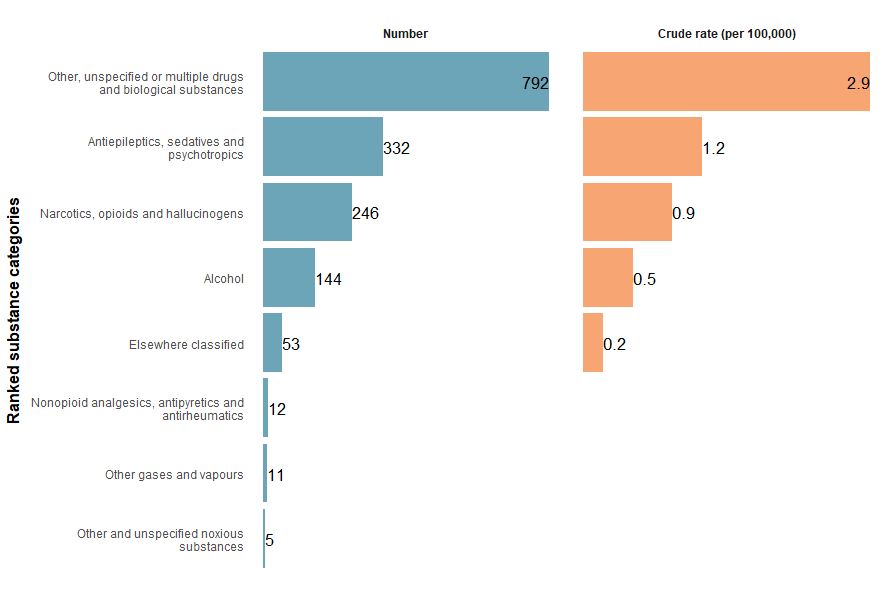
Note: Rates where the numerator is less than 10 are not shown due to data volatility.
Sources: AIHW National Mortality Database and ABS National, state and territory population.
For more detail, see Supplementary data tables (Poisoning Tables 1, 7 and 8).
Trends over time
There is a break in the time series for hospitalisations between 2016–17 and 2017–18 due to a change in data collection methods (see the technical notes for details).
The number of accidental poisoning hospitalisations has generally decreased over the past decade (Figure 3).
Between 2017–18 and 2024–25, the rate decreased from 46.0 to 37.3 per 100,000 population, an average decline of 1.8% per year (Figure 3).
Figure 3: Injury hospitalisations due to accidental poisoning, 2015–16 to 2024–25
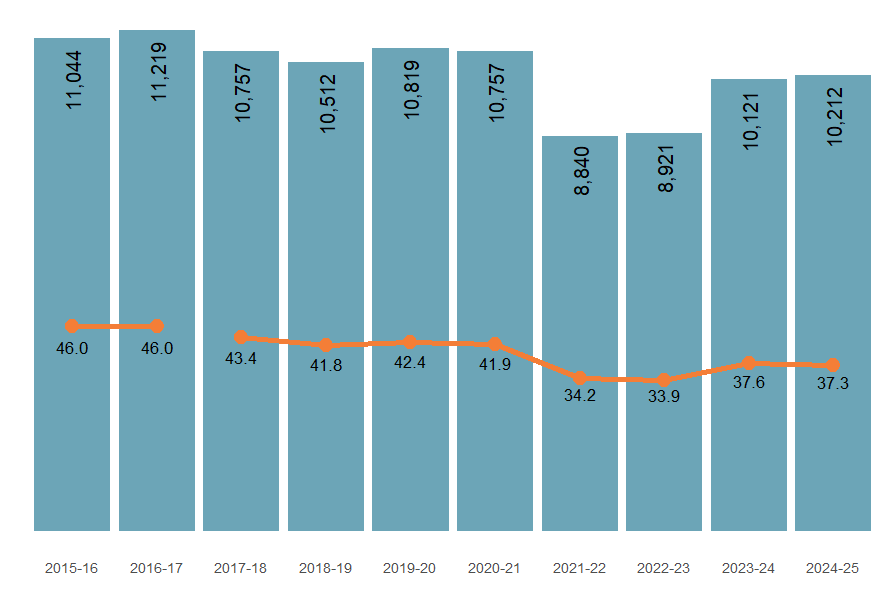
Note: Columns represent the number of hospitalisations, the line graph represents the crude rate (per 100,000 population).
Source: AIHW National Hospital Morbidity Database and ABS National, state and territory population.
Between 2014–15 and 2023–24, the accidental poisoning mortality rate decreased by an average of 0.9% per year (Figure 4).
Figure 4: Injury deaths due to accidental poisoning, 2014–15 to 2023–24
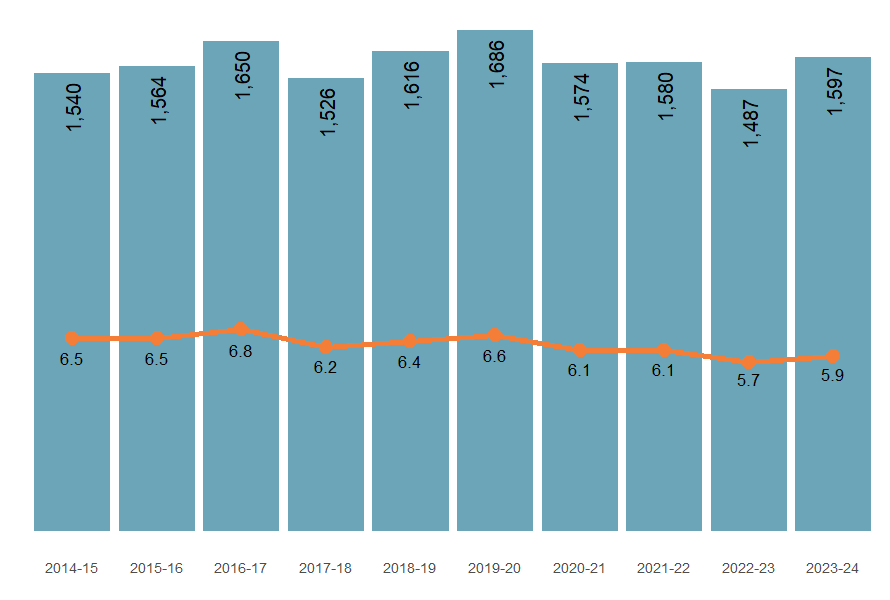
Note: Columns are the number of deaths, the line graph represents the crude mortality rate per 100,000 population.
Source: AIHW National Mortality Database.
The trends differed depending on the type of substance involved. Compared to the previous 5-year average, in 2024–25 hospitalisation rates due to:
- other and unspecified drugs and biological substances increased by 13.3%
- antiepileptics, sedatives and psychotropics decreased by 11.8% (Figure 5a).
Figure 5a: Injury hospitalisations (2015–16 to 2024–25) and deaths (2014–15 to 2023–24) due to accidental poisoning, by category of substance
Rates of hospitalisation and death have decreased for most poison types over the last decade.
Figure 5b: Injury hospitalisations due to accidental poisoning, hospitalisations by detailed type of substance, 2015–16 to 2024–25
Interactive graphs showing the ranking and trends of different substances recorded in the primary diagnoses as causing accidental poisoning hospitalisations over the past decade

Figure 6: Injury hospitalisations (2024–25) and deaths (2023–24) due to accidental poisoning, by calendar month
Interactive graph showing the number of accidental poisoning injury hospitalisations and deaths by month in the latest year compared to the previous 5-year average, by substance category.]
Figure 7: Percentage of accidental poisoning hospitalisations requiring ICU care or ventilatory support, 2015–16 to 2024–25
Interactive graphs showing the percentage of accidental poisoning injury hospitalisations requiring ICU or CVS over the past decade, by type of substance

Figure 8: Injury hospitalisations (2015–16 to 2024–25) and deaths (2014–15 to 2023–24) due to accidental poisoning, by age group and sex
Interactive graphs displaying age and sex trends over the past decade for accidental injury hospitalisations by selected substance type.
Accidental poisoning in children aged 0–4
Children aged 0 to 4 have consistently exhibited the highest rates of accidental poisoning hospitalisation over the last decade for multiple substance categories, including (Figure 8):
- nonopioid analgesics, antipyretics and antirheumatics
- antiepileptics, sedatives and psychotropics
- unspecified drugs, medicaments and biological substances
- organic solvents and hydrogenated hydrocarbons and their vapours
- pesticides
Hospitalisation rates among children aged 0–4 have fluctuated in recent years. The rate decreased from 93.6 per 100,000 in 2017–18 to 77.0 per 100,000 in 2022–23 (an 18% decrease) but subsequently increased to 88.2 per 100,000 in 2024–25.
The main causes of accidental poisoning in this age group are pharmaceutical substances. Specifically:
- There has been an increase in poisoning from other and unspecified drugs and biological substances, rising from 26.8 to 32.5 per 100,000 between 2022–23 and 2024–25.
- Cases involving antiepileptics, sedatives and psychotropics increased from 13.9 to 16.1 per 100,000 in the same period.
- Similarly, the rate for nonopioid analgesics, antipyretics and antirheumatics increased from 6.5 to 9.3 per 100,000, reversing a previous downward trend before 2022–23.
By contrast, hospitalisation rates for poisoning caused by non-pharmaceutical substances, such as other and unspecified chemicals and noxious substances, have remained stable over this period.
For more detail, see Supplementary data tables (Poisoning Tables 1 and 2).
First Nations people
Among Aboriginal and Torres Strait Islander (First Nations) people:
- there were 998 hospitalisations due to accidental poisoning in 2024–25 (95.1 per 100,000)
- males and females were hospitalised at similar rates (96.8 and 93.2 per 100,000 population)
- hospitalisation rates were highest among people aged 0–4 (Figure 9).
Figure 9: Injury hospitalisations due to accidental poisoning among First Nations people, by age and sex, 2024–25
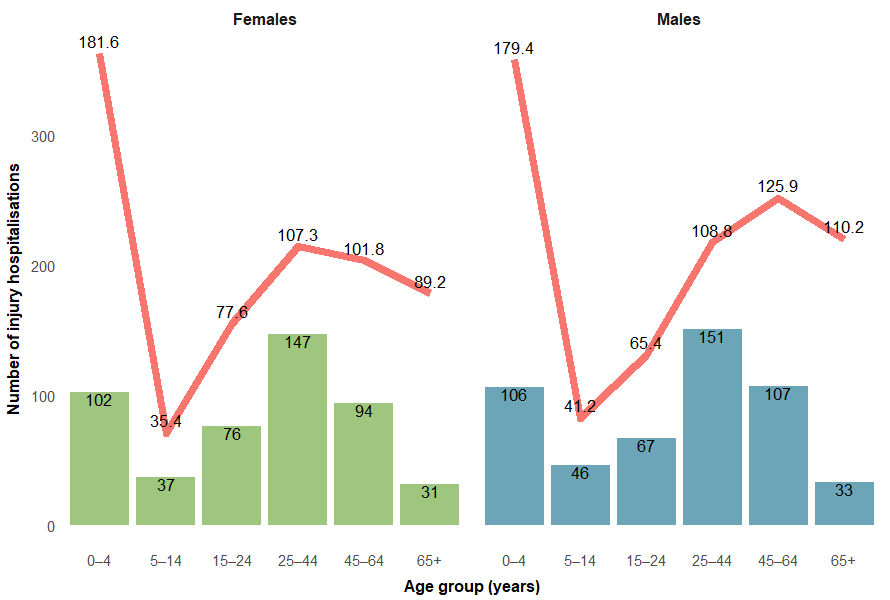
Note: Columns are number of hospitalisations, the line graph is the crude rate per 100,000 population.
Sources: AIHW National Hospital Morbidity Database, ABS Estimates and Projections, Aboriginal and Torres Strait Islander Australians.
Among First Nations people:
- there were 148 deaths due to accidental poisoning in 2023–24 (14.4 per 100,000)
- males were twice as likely as females to die of accidental poisoning (19.2 and 9.5 per 100,000 population respectively) (Table 2).
Sex | Number of injury deaths | Crude mortality rate (per 100,000 population) |
|---|---|---|
Males | 99 | 19.2 |
Females | 49 | 9.5 |
Persons | 148 | 14.4 |
Note: Numbers and rates are reported for the following 5 jurisdictions combined: New South Wales, Queensland, Western Australia, South Australia and the Northern Territory. These jurisdictions are considered to have adequate levels of Indigenous identification in mortality data.
Sources: AIHW National Mortality Database, ABS Estimates and Projections, Aboriginal and Torres Strait Islander Australians.
For more detail, see Supplementary data tables (Poisoning Table 5).
Comparison between First Nations people and non-Indigenous Australians
Compared with non-Indigenous Australians, First Nations people were:
- 3 times as likely to be hospitalised due to accidental poisoning in 2024–25
- 5.6 times as likely to die from accidental poisoning in 2023–24 (Figure 10).
Figure 10: Injury hospitalisations (2017–18 to 2024–25) and deaths (2017–18 to 2023–24) due to accidental poisoning, by Indigenous status
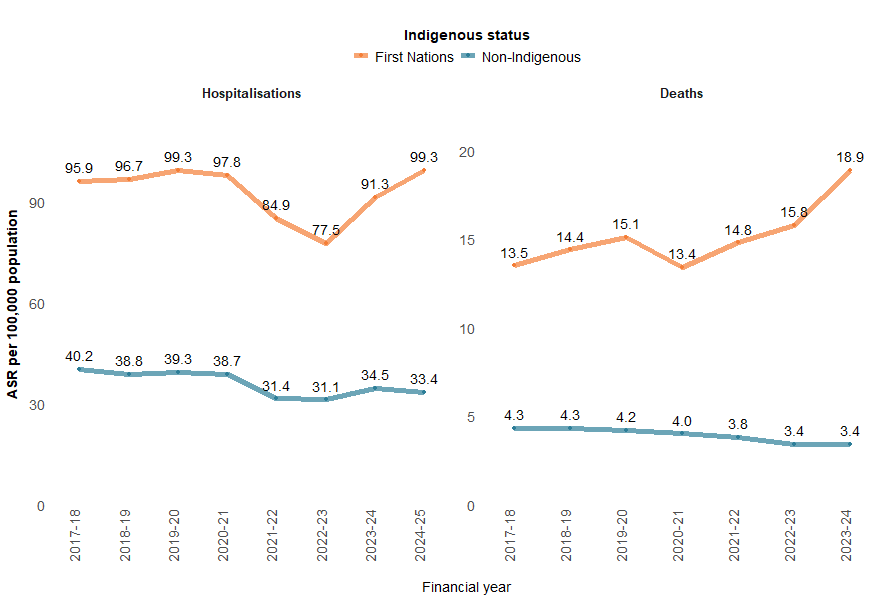
Notes:
- Age-standardised rate per 100,000 population.
- ‘Non-Indigenous’ excludes cases where Indigenous status is missing or not stated.
- Deaths data only includes data for people whose usual residence was New South Wales, Queensland, Western Australia, South Australia, and the Northern Territory, as these jurisdictions are considered to have adequate levels of Indigenous identification in mortality data.
Sources: AIHW National Hospital Morbidity Database, AIHW National Mortality Database, ABS Estimates and Projections, Aboriginal and Torres Strait Islander Australians.
In 2024–25, the injury hospitalisation rate for accidental poisoning was highest among the 0–4 age group for both First Nations and non-Indigenous Australians (Figure 11). However, hospitalisation rates for First Nations children were more than twice that of non-Indigenous children (a pattern observed across all age groups).
Data for deaths are not presented because of small numbers.
Figure 11: Injury hospitalisations due to accidental poisoning, by Indigenous status and age group, 2024–25
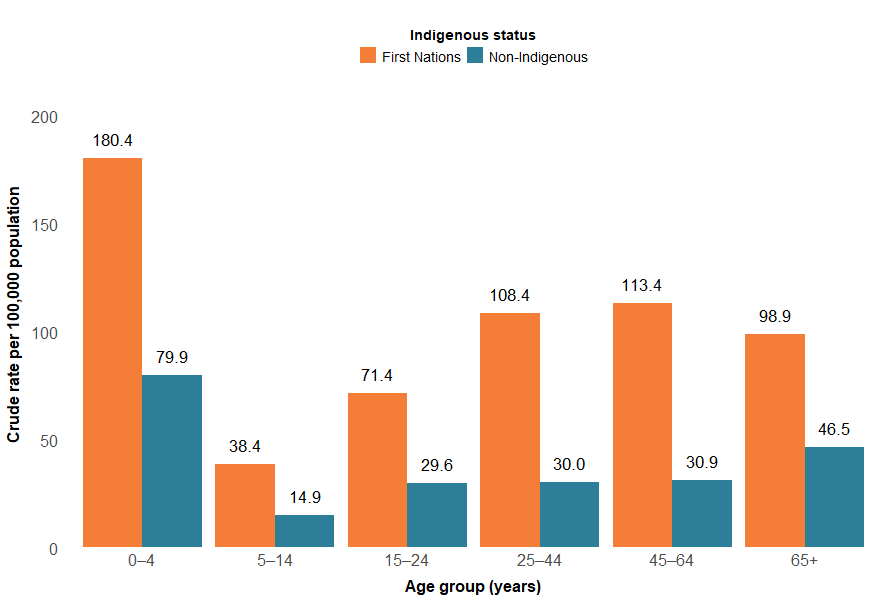
Notes:
- Crude rate per 100,000 population.
- ‘Non-Indigenous’ excludes cases where Indigenous status is missing or not stated.
Source: AIHW National Hospital Morbidity Database, ABS Estimates and Projections, Aboriginal and Torres Strait Islander Australians.
For more detail, see Supplementary data tables (Table H5 and Poisoning Table 5).
States and territories
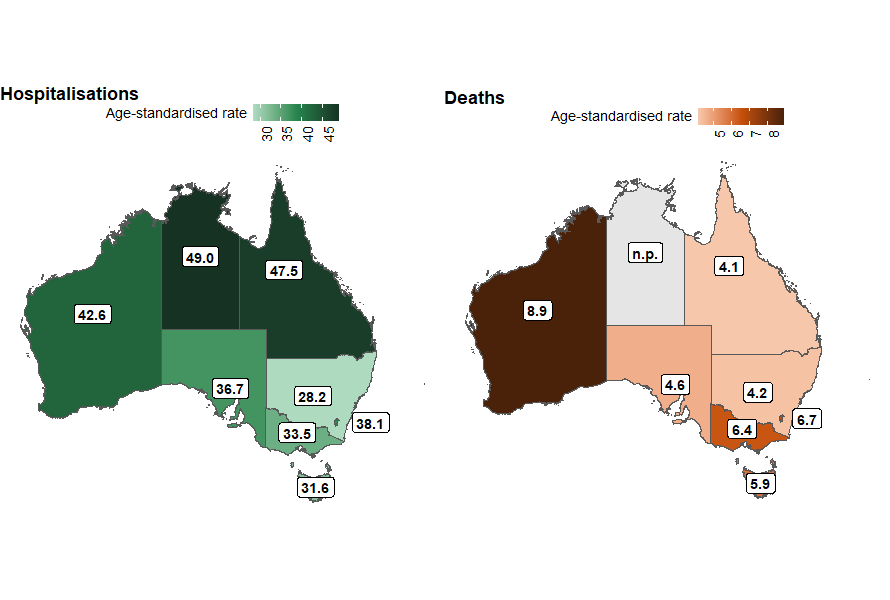
The states and territories with the highest rates of accidental poisoning hospitalisation in 2023–24 were:
- Northern Territory (49.0 per 100,000)
- Queensland (47.5 per 100,000)
- Western Australia (42.6 per 100,000) (Figure 12).
The states and territories with the highest rates of accidental poisoning deaths (where available) in 2022–23 were:
- Western Australia (8.9 per 100,000)
- Australian Capital Territory (6.7 per 100,000)
- Victoria (6.4 per 100,000) (Figure 12).
Figure 12: Age-standardised rate of accidental poisoning hospitalisations (2023–24) and deaths (2022–23), by state of usual residence, Australia
Notes:
- State and territory refers to the state and territory of usual residence for the individual.
- Age-standardised rate per 100,000 population.
Sources: AIHW National Hospital Morbidity Database, AIHW National Mortality Database, and ABS National, state and territory population.
There are some differences in trends across states by type of substance involved (Figure 13). As compared to the previous 5-year average, 2023–24 saw an increased percentage of hospitalisations due to other and unspecified drugs, medicaments and biological substances across all states and territories except the Northern Territory. In 2022–23 there was an increase in overall poisoning death rates in the Australian Capital Territory and Tasmania.
Figure 13: Percentage difference in age-standardised rates of accidental poisoning injury hospitalisations (2023–24) and deaths (2022–23) compared to the previous 5-year average, by state or territory of usual residence, Australia
The rate of hospitalisation for accidental poisoning increased by 8.5% in Tasmania, and decreased in every other state and territory.
Figure 14: Age-standardised rates of accidental poisoning hospitalisations, by remoteness, type of substance and financial year, Australia
For all types of substances, rates of hospitalisation for accidental poisoning increase with remoteness.

Figure 15: Age-standardised rates of accidental poisoning hospitalisations, by socioeconomic areas, type of substance and financial year, Australia
Interactive graphs displaying trends in accidental injury hospitalisations over the past decade by selected type of substance and socioeconomic status of area of usual residence
