Specialist Homelessness Services: feature analysis:
People with a history of specialist homelessness services support who have died
Web article
Last updated:
Topic: Homelessness services
Citation
AIHW (Australian Institute of Health and Welfare) (2025) People with a history of specialist homelessness services support who have died, AIHW, Australian Government, accessed 25 July 2026.
This article is part of Specialist Homelessness Services: feature analysis
Clients
Outcomes
- Children with a history of specialist homelessness services support who have died
- People receiving specialist homelessness services support in the last year of life
- People who received specialist homelessness services and alcohol and other drug treatment services who have died
- People with a history of specialist homelessness services support who have died This page
People who experience homelessness have a higher prevalence and severity of physical and mental health conditions than other Australians (see Health of people experiencing homelessness; Gordon et al. 2025). Any experience of homelessness – from couch surfing to rough sleeping – increases the risk of an early death (see People receiving specialist homelessness services support in the last year of life; Seastres et al. 2020; Zordan et al. 2023). In Australia, there is an estimated life expectancy gap of more than three decades between people who have experienced homelessness and people who have not (Tuson et al. 2024).
Understanding the characteristics, service needs and causes of death among people with a history of specialist homelessness services (SHS) support who have died can help to inform improvements to service provision and outcomes for clients.
Analyses presented in this article are based on data from the NACS linked dataset. Linkage rates and SHS data coverage issues in the early years of the collection mean that the results are likely to be an underestimate of people with a history of SHS support who have died.
Defining people with a history of SHS support who have died
People who received support from specialist homelessness services (SHS) at any time since 2011–12 and who died between 2012–13 and 2022–23 are described in this article. Throughout the article, ‘people with a history of SHS support who have died’, or simply ‘people who died’, refers to this group unless otherwise stated (for example, ‘SHS clients’ is used when comparing people with a history of SHS support who died with people without any history of SHS support who have died).
Analysis coverage for people with a history of SHS support who have died
People with a history of SHS support who have died are presented by the amount of time since their last SHS support period ended and death: ongoing, up to 12 months, 1–2 years and more than 2 years.
People who died while receiving ongoing SHS support refers to people who died either with an open support period or on the day support ended. Importantly, this classification does not imply any relationship between the support provided and the individual’s death. In some cases, the SHS agency may have closed the support period after learning of the individual’s death. For more information about support periods, see Specialist Homelessness Services Collection (SHSC).
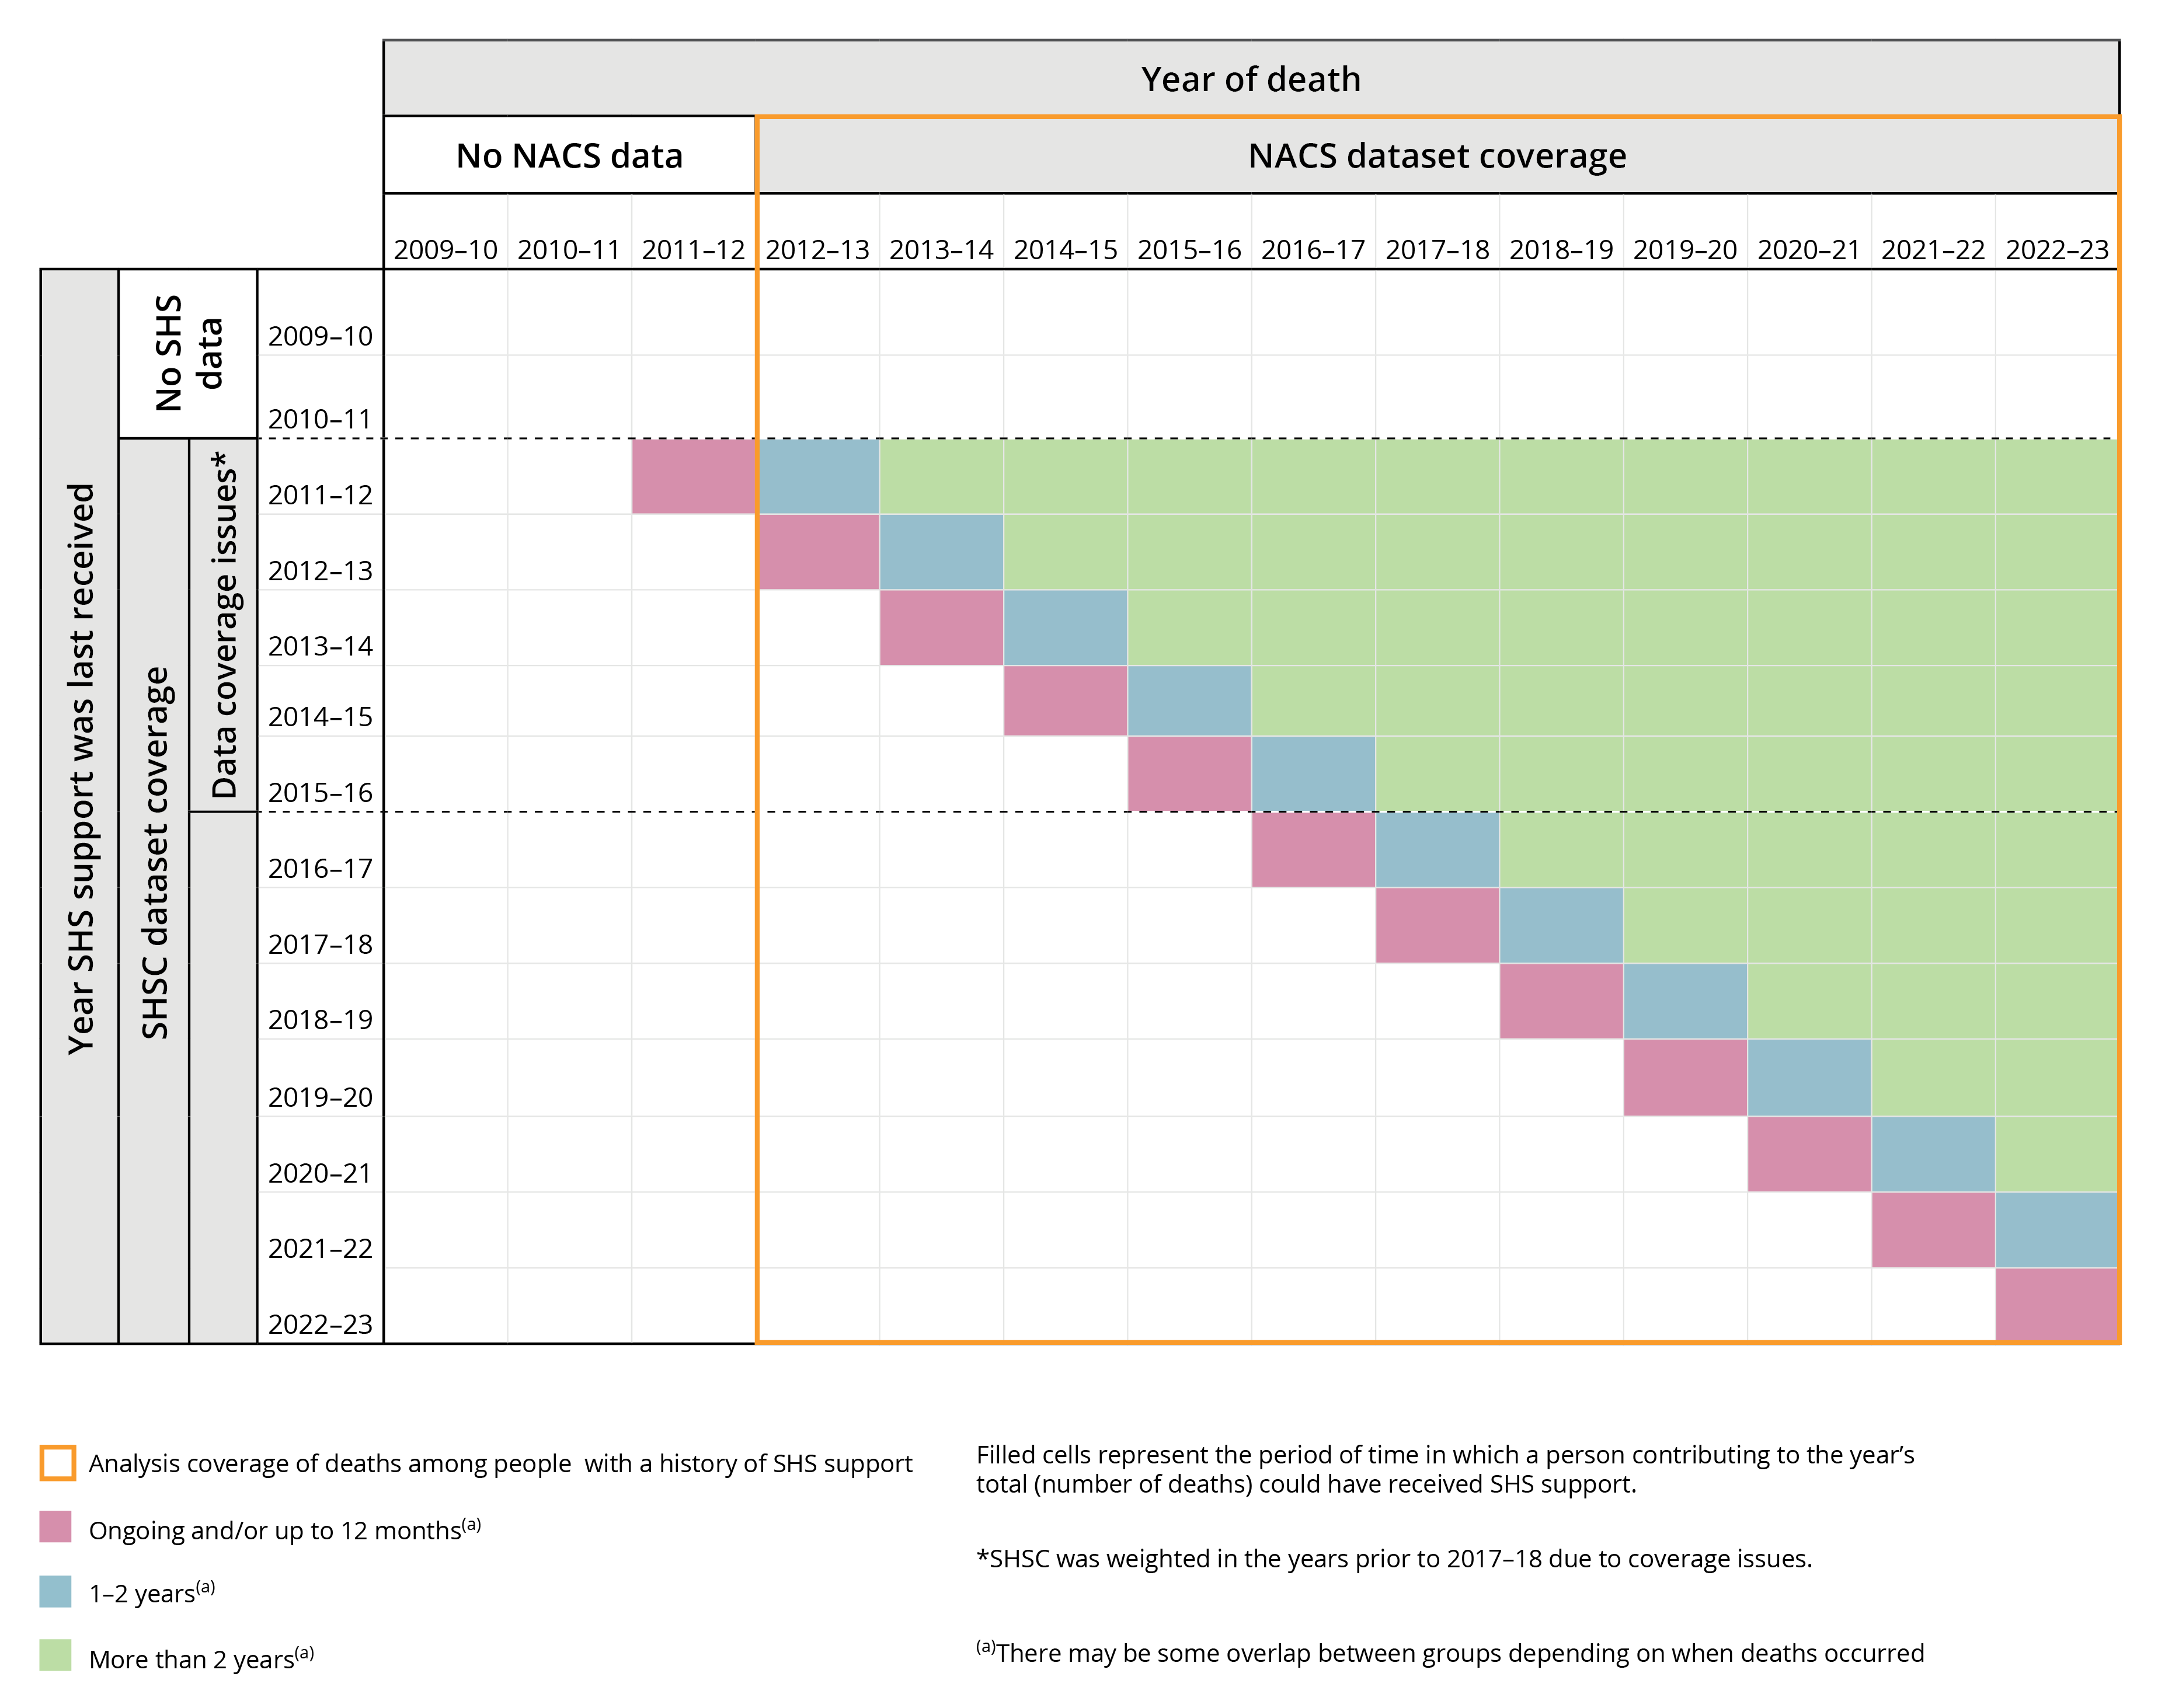
The SHSC began in July 2011, limiting data coverage of the category ‘people who died more than 2 years since receiving SHS support’. For example:
- the number of people who died in 2014–15 more than 2 years since their last SHS support includes people who could have last received support in 2011–12 or 2012–13 (a 2-year period).
- the number of people who died in 2022–23 more than 2 years since their last SHS support includes people who could have last received support at any time between 2011–12 and 2020–21 (a 10-year period).
An illustration of these coverage issues is provided below (Figure 1). No attempt has been made to correct for the varied amount of time people could have received SHS support.
Figure 1: Analysis coverage of deaths among people with a history of support
At the time of analysis, the cause of death information included in the National Death Index database was considered final for deaths registered prior to 2021, revised for deaths registered in 2021, and preliminary for deaths registered in 2022 and 2023. Preliminary data are subject to further revision.
For help or support
The AIHW respectfully acknowledges the people who have died who are described in this article.
The material presented below may be distressing. Support is available via the following:
- Crisis and support services for a comprehensive list of organisations providing support
- Ask Izzy for connections to support services.
Key findings
Throughout 2012–13 to 2022–23, around 43,200 people with a history of SHS support died (25,600 males and 17,700 females). Among these:
- Around 3,100 people died while receiving ongoing SHS support – around 5 deaths each week.
- The median age at death was 55 years.
- Over half (56%) had a recorded history of having experienced homelessness.
- Any experience of rough sleeping recorded by SHS agencies was associated with a younger age at death – around a decade difference compared with SHS clients who had not experienced homelessness.
- Accidental poisoning, coronary heart disease and suicide were leading underlying causes of death.
- The proportion who died by natural causes (between 55% and 76%) was lower than non-SHS clients (92%).
In 2022–23, almost 100 years (94 years) of potential life were lost each day to people who received SHS support in the last year of life.
In 2022–23, there were around 9 potentially avoidable deaths per day among people with a history of SHS support, accounting for around 1 in 8 potentially avoidable deaths nationally.
Characteristics of people with a history of SHS support who have died
Throughout 2012–13 to 2022–23, around 43,200 people with a history of SHS support died. Of these, around 3,100 people died while receiving ongoing SHS support – equating to around 5 deaths per week.
The median age at death among all people with a history of SHS support was 55 years.
Throughout 2012–13 to 2022–23, around 43,200 people with a history of SHS support died: around 25,600 males (59%) and 17,700 females (41%) (Figure 2). Almost half (48%) of deaths occurred within 2 years of receiving SHS support, including:
- 3,100 (7.1%) people who died while support was ongoing
- 10,900 (25%) people who died up to 12 months after ceasing support
- 6,700 (15%) people who died between 1 and 2 years after support ended.
The remaining 22,600 deaths (52%) occurred more than 2 years since support ceased.
Throughout 2012–13 to 2022–23, the median age at death was 55 years (55 for males, 56 for females) (Supplementary table 2.1). People who died closer to the time they last received SHS support tended to die at younger ages than people who died after more time had passed (Figure 2). The median age at death was:
- 49 years for people who died while support was ongoing
- 60 years for people who died more than 2 years since support ceased.
The difference in median age at death was larger among females: 46 years when SHS support was ongoing and 60 years when support ended more than 2 years prior to death, compared with males (50 and 59, respectively) (Supplementary table 2.1).
Figure 2: People with a history of SHS support who have died, by age at death and time since last SHS support, 2012–13 to 2022–23
Grouped column chart showing 36% of people who died more than 2 years since SHS support died aged 65 or above, compared with 16% of people who died while support was ongoing.

Source: Supplementary table 2.1.
Note: At the time of analysis, the cause of death information included in the National Death Index database was considered final for deaths registered prior to 2021, revised for deaths registered in 2021, and preliminary for deaths registered in 2022 and 2023. Preliminary data are subject to further revision.
Potential years of life lost
Potential years of life lost (PYLL) is an estimate of the number of years longer a person might have lived had they not died prematurely. For example, dying before the age of 75 is considered premature; therefore, a person who died aged 55 would have lost 20 years of potential life. For more information, see Deaths in Australia, Age at death.
Increasing data coverage of the SHSC contributes to observed changes over time in the scale of PYLL (see Definition and data quality issues). Earlier years are likely to be an underestimate, and caution should be used when interpreting time series data.
In 2022–23, almost 100 years (94 years) of potential life were lost each day to people who died either while SHS support was ongoing, or up to 12 months after support had ended.
In 2022–23, people with a history of SHS support who died contributed around 15% (121,400) of PYLL nationally – reflecting the low median age at death (55 years) among the cohort (Supplementary tables 2.2 and 2.3).
Potential years of life lost by sex
In 2022–23, as a proportion of PYLL among females nationally, females with a history of SHS support contributed around 17%. Comparatively, males with a history of SHS support contributed around 14% of PYLL among males nationally (Supplementary table 2.3).
Each year from 2012–13 to 2022–23, males accounted for a majority (57–63%) of PYLL among people with a history of SHS support (Supplementary table 2.3). The difference between males and females narrowed over the 5 years to 2022–23:
- In 2017–18, males contributed 62% of PYLL, females 38%
- In 2022–23, males contributed 57% of PYLL, females 43%.
Potential years of life lost by time since support
In 2022–23, people who died while SHS support was ongoing or up to 12 months after support ended (28% or 34,100 years combined) contributed more than a quarter of PYLL among people with a history of SHS support. This equates to almost 100 years (94 years) of potential life lost each day among people who had received SHS support in their last year of life (Supplementary table 2.3). For more information about this group, see People receiving specialist homelessness services support in the last year of life.
In 2022–23, among people with a history of SHS support who died, the majority (72%) of PYLL were among those who died more than 1 year since last receiving SHS support, including (Supplementary table 2.3):
- 15,300 (13%) PYLL among people who died between 1 and 2 years after support
- 72,000 (59%) PYLL among people who died more than 2 years after support.
Experience of homelessness
The homelessness status and last known housing situation of people with a history of SHS support who died are explored below. For more information about how these variables are derived, refer to Data presentation and derivations.
Throughout 2012–13 to 2022–23, over half (56%) of people with a history of SHS support who died had an SHS recorded history of having experienced homelessness.
Any experience of rough sleeping recorded by SHS agencies was associated with a younger age at death – around a decade difference compared with SHS clients who had not experienced homelessness.
Any history of homelessness
Throughout 2012–13 to 2022–23, over half (56%) of people with a history of SHS support who died had a recorded history of having experienced homelessness, including around (Supplementary table 2.2):
- 11,600 people (27%) with a recorded history of rough sleeping
- 12,500 people (29%) with a recorded history of other homelessness.
Any experience of homelessness as recorded by the SHS agency, particularly rough sleeping, was associated with a younger age at death. The difference in median age at death between people who had experienced rough sleeping (50 years) and people who had not experienced any form of homelessness (61 years) while in contact with SHS agencies was around 11 years (Supplementary table 2.2).
Among people who died with a history of rough sleeping, 3 in 4 (75%) were male. Males (34% of males who had died) were twice as likely as females (17%) to have died with a history of rough sleeping recorded by the SHS agency (Figure 3). Although females are generally less likely to experience rough sleeping than males (AIHW 2024b; Bullen 2019), the health effects of rough sleeping may be more impactful on females (Box et al. 2022). Females (48 years) with a history of rough sleeping had a younger median age at death than males (51 years) (Supplementary table 2.2).
Figure 3: People with a history of SHS support who have died, by homelessness status and sex, 2012–13 to 2022–23
Stacked bar chart showing the percentage of people who died with a last known housing situation of homelessness decreased as time since last SHS support increased.

Source: Supplementary table 2.2.
Note: At the time of analysis, the cause of death information included in the National Death Index database was considered final for deaths registered prior to 2021, revised for deaths registered in 2021, and preliminary for deaths registered in 2022 and 2023. Preliminary data are subject to further revision.
Last known housing situation
Throughout 2012–13 to 2022–23, the most common last known housing situation among people with a history of SHS support who have died were (Supplementary table 2.4):
- private or other housing (30%; 11,700 deaths)
- public or community housing (27%; 10,700 deaths)
- short-term temporary accommodation (17%; 6,500 deaths).
In part, this reflects the most common housing situations among all SHS clients (see Specialist homelessness services annual report 2023–24).
Throughout 2012–13 to 2022–23:
- among people who died while SHS support was ongoing, 1 in 4 (25%) were living in short-term temporary accommodation (Figure 4)
- among people who died more than 2 years since SHS support, 1 in 3 (34%) were last known to be in private or other housing (Figure 4).
- Regardless of time since SHS support, females were more likely than males to have died with a last known housing situation of private or other housing (37% compared with 25%). By contrast, males were more likely to have died with a last known housing situation of short-term temporary accommodation (19% compared with 12%) (Supplementary table 2.4).
Figure 4: People with a history of SHS support who have died, by last known housing situation and time since last support, 2012–13 to 2022–23
Stacked bar chart showing that SHS clients that died more than 2 years since SHS support, over two thirds (67%) were at risk of homelessness.

Source: Supplementary table 2.4.
Note: At the time of analysis, the cause of death information included in the National Death Index database was considered final for deaths registered prior to 2021, revised for deaths registered in 2021, and preliminary for deaths registered in 2022 and 2023. Preliminary data are subject to further revision.
Underlying cause of death
For information about how causes of death are classified, see Injury in Australia: Accidental poisoning and Technical notes.
Throughout 2012–13 to 2022–23, the leading underlying causes of death among people with a history of SHS support were accidental poisoning, coronary heart disease and suicide.
Throughout 2012–13 to 2022–23, accidental poisoning, coronary heart disease and suicide were the most common underlying causes of death among both males and females with a history of SHS support, together accounting for 12,500 deaths (29%). The ranking of these leading underlying causes of death varied by sex and time since last support (Figure 5).
Underlying cause of death by sex
Throughout 2012–13 to 2022–23, females with a history of SHS support were less likely than males to have died from accidental poisoning (9.0% of females compared with 12% of males) and coronary heart disease (6.9% of females compared with 11% of males) (Supplementary table 2.5). Females were more likely to have died from suicide while support was ongoing (16% of deaths among ongoing female clients) compared with males (13%) (Figure 5).
Underlying cause of death by time since last SHS support
As more time passed between last SHS support and death, people with a history of SHS support were more likely to have died from a wider range of chronic health-related causes. Throughout 2012–13 to 2022–23, death from coronary heart disease became more likely, and death by accidental poisoning or suicide became less likely as the time since SHS support increased (Figure 5). Together, accidental poisoning and suicide accounted for (Supplementary table 2.5):
- around 1 in 3 (33% or 1,000 deaths) people who died while support was ongoing
- over 1 in 4 (28% or 3,000 deaths) people who died up to 12 months after ceasing support
- around 1 in 5 (20% or 1,300 deaths) people who died between 1 and 2 years since support ended
- around 1 in 7 (14% or 3,200 deaths) people who died more than 2 years since support ceased.
Figure 5: People who died with a history of SHS support, by underlying causes of death and sex, 2012–13 to 2022–23
Stacked column chart showing the most common causes of death in SHS clients that received ongoing support when they died was accidental poisoning, suicide and coronary heart disease.

Source: Supplementary table 2.5.
Note: At the time of analysis, the cause of death information included in the National Death Index database was considered final for deaths registered prior to 2021, revised for deaths registered in 2021, and preliminary for deaths registered in 2022 and 2023. Preliminary data are subject to further revision.
Underlying cause of death by last known housing situation
Throughout 2012–13 to 2022–23, around 1 in 3 (32%) people with a history of SHS support who died by coronary heart disease had a last known housing situation of homeless. Comparatively, around half of people who died by accidental poisoning (50%) or suicide (46%) had a last known housing situation of homeless (Supplementary table 2.6).
Throughout 2012–13 to 2022–23, the last known housing situation of people who died by accidental poisoning and suicide were relatively similar (around half – 50% and 46%, respectively – were last known to be experiencing homelessness). However, people who died by suicide were more likely to have a last known housing situation of private or other housing (29% compared with 19%), while those who died by accidental poisoning were more likely to be in public or community housing (21% compared with 17%) (Supplementary table 2.6).
Natural causes of deaths
Natural causes of death exclude deaths where the underlying cause of death was coded to an external cause of death (ICD-10 V01–Y98) or an unknown cause (R99). For more information see Causes of Death, Australia methodology (ABS 2023).
Throughout 2012–13 to 2022–23, the proportion of SHS clients who died by natural causes (between 55% and 76%) was lower than among non-SHS clients (92%).
Throughout 2012–13 to 2022–23, SHS clients (between 55% and 76%) were less likely to have died from natural causes than non-SHS clients (92%). However, as the time since last SHS support increased, SHS clients who died were more likely to have died from natural causes (Supplementary table 2.7). Compared with non-SHS clients who died of natural causes (92%):
- Over half (55%) of people who died while SHS support was ongoing died from natural causes
- Over 3 in 5 (61%) people who died 12 months after ceasing SHS support died from natural causes
- Around 7 in 10 (70%) people who died between 1 and 2 years after ceasing SHS support died from natural causes
- Over 3 in 4 (76%) people who died more than 2 years since SHS support ceased died from natural causes.
Among clients experiencing rough sleeping and receiving ongoing support, under half (46%) died of natural causes – a lower proportion than clients who died more than 2 years after support ended with a last known housing situation of rough sleeping (70%) (Supplementary table 2.7).
Psychosocial factors involved in deaths
Psychosocial factors are the non-medical circumstances that can play a role in a person’s death. Psychosocial factors are primarily recorded for coroner-referred deaths, with less frequent recording in doctor-certified deaths (ABS 2024). The AIHW has developed a framework for grouping psychosocial factors to broadly align with the determinants of health. For more information and examples of psychosocial factors, see What do Australians die from?
People with a history of SHS support who died by accidental poisoning
Throughout 2017 to 2023, an average of 2 psychosocial factors were recorded per death by accidental poisoning among people with a history of SHS support (Supplementary table 2.8). Issues surrounding support systems – often involving the death or disappearance of a family member – were relatively common for both males and females who died by accidental poisoning, involved in around:
- 1 in 3 (34%) deaths among females
- 1 in 4 (24%) deaths among males.
Throughout 2017 to 2023, policing and justice factors – such as recent release from prison or problems related to other legal circumstances – were the most common psychosocial factor among males who died by accidental poisoning (43%) and less likely among females (24%). Issues relating to intimate partners – such as relationship distress or breakdown – were more likely among females who died by accidental poisoning (22%) than males (12%) (Supplementary table 2.8).
People with a history of SHS support who died by suicide
Throughout 2017 to 2023, people with a history of SHS support who died by suicide had an average of 2.6–3 psychosocial factors recorded per death. Among people who died by suicide, suicide ideation was the most common factor (recorded in around 2 in 5 deaths for both females and males) (Supplementary table 2.8).
For people with a history of SHS support who died by suicide between 2017 and 2023 (Supplementary table 2.8):
- Issues with support system factors, a personal history of self-harm and issues surrounding intimate partners were the next most common recorded psychosocial factors for both males and females, albeit with different rankings.
- A personal history of self-harm was more common among females (51%) than males (39%).
- Issues surrounding policing and justice were more common among males (33%) than females (15%).
Potentially avoidable deaths
Potentially avoidable deaths are deaths from conditions that could have been prevented or treated with timely and effective health care. Potentially avoidable deaths are classified using nationally agreed definitions based on cause of death for people aged under 75. For more information, see the Australian Health Performance Framework.
Note that potentially avoidable deaths contribute to but do not account for total potential years of life lost, the latter being a measure of all premature death (not just death that was potentially avoidable).
Potentially avoidable deaths in people who died between the age of 1–74 with a history of SHS support are explored below. Increasing data coverage of the SHSC contributes to observed changes over time in the number and proportion of potentially avoidable deaths (see Definition and data quality issues). Earlier years are likely to be an underestimate, and caution should be used when interpreting time series data.
In 2022–23, there were around 9 potentially avoidable deaths per day among people with a history of SHS support, accounting for around 1 in 8 potentially avoidable deaths nationally.
In 2022–23, over half of deaths (56%; around 3,100 deaths) among people with a history of SHS support were potentially avoidable, equating to more than 9 potentially avoidable deaths per day (Supplementary table 2.9).
Each year from 2012–13 to 2022–23, deaths among SHS clients were more likely to have been potentially avoidable (56–64% of all deaths) than deaths among non-SHS clients (43–47%) – particularly among females (53–61% compared with 35–39%) (Figure 6).
In 2022–23, deaths among people who died while SHS support was ongoing (62%) or up to 12 months after ceasing support (62%) were more likely to have been potentially avoidable, compared with people who died 1–2 years after (56%) or more than 2 years after (53%) support (Supplementary table 2.9).
Figure 6: Potentially avoidable deaths among people aged 1–74 with a history of SHS support and non-SHS clients, 2018–19 to 2022–23
Column chart showing SHS clients who died accounted for a greater proportion of potentially avoidable deaths compared to non-SHS clients.

Source: Supplementary table 2.9.
Note: At the time of analysis, the cause of death information included in the National Death Index database was considered final for deaths registered prior to 2021, revised for deaths registered in 2021, and preliminary for deaths registered in 2022 and 2023. Preliminary data are subject to further revision.
NACS dataset
The NACS linked dataset includes:
- National Deaths Index (NDI)
- Alcohol and Other Drug Treatment Services National Minimum Data Set (AODTS-NMDS)
- Commonwealth funded health services (MBS and PBS)
- Specialist Homelessness Services Collection (SHSC).
See the Technical notes for more information about the linkage process and details of the dataset years included in the NACS.
Data presentation
Throughout this article:
- Values presented in the columns and rows of tables may not sum to the totals shown due to missing and not stated values, as well as rounding.
- Totals reported include missing and not stated values, unless otherwise noted.
- The percentages shown in the tables are calculated excluding the missing and not stated values, unless indicated otherwise.
- Percentage distributions may not sum to 100 due to rounding.
- The Australian Institute of Health and Welfare (AIHW) has strict confidentiality policies which have their basis in section 29 of the Australian Institute of Health and Welfare Act 1987 (AIHW Act) and the Privacy Act 1988 (Privacy Act). Data may be suppressed for either confidentiality reasons or where estimates are based on small numbers, resulting in low reliability. Information that results in attribute disclosure will also be suppressed.
Deaths data and statistics
Data for the number of deaths is sourced from the NACS linked dataset. Deaths in this report are presented by year of occurrence. In the version of the NDI database used in the NACS, data were considered final deaths registered prior to 2021, revised for deaths registered in 2021 and preliminary for deaths registered in 2022 and 2023.
The number of deaths in this report are not comparable to other AIHW publications, such as Deaths in Australia, due to:
- different data sources (National Death Index compared with the AIHW mortality database)
- year of death occurrence compared with year of death registration.
More information on deaths data and statistics for the NACS linked dataset are available in the Technical notes.
Specialist homelessness services
Client counts
The number of clients presented in this report will not necessarily match totals presented in other reports. This is more marked for years prior to 2017–18, where SHSC data in other reports were imputed to account for agency non-response and invalid SLKs. Imputation was not required from 2018–19 due to the high rates of agency response and SLK validity. Imputation was not applied to the SHSC data for this project.
Homelessness status
Homelessness status is derived at the support period level, using information about a client’s type of residential arrangement (termed housing situation), their tenure and conditions of occupancy. Housing situation is available at 3 different time points for every support period within the NACS data:
- a week before they present to an SHS agency
- at presentation
- at the end of support
The table below describes the different housing situations and how they are classified into experiences of homelessness within this report.
Housing situation | Homelessness status |
|---|---|
No shelter or improvised/inadequate dwelling | Rough sleeping |
Short–term temporary accommodation | Other homeless |
House, townhouse or flat – couch surfer or with no tenure | Other homeless |
Other – homeless | Other homeless |
Public or community housing – renter or rent free | Not homeless |
Private or other housing – renter, rent free or owner | Not homeless |
Institutional settings | Not homeless |
Other – at risk | Not homeless |
Not stated | Not stated |
The homelessness status of SHS clients described in this report uses all support periods that started, ended or were ongoing within a year using a cascading hierarchy. That is, clients are hierarchically reported in only one category in the following order:
- 'Rough sleeping' if they had ever reported rough sleeping
- 'Other homeless' if rough sleeping does not apply and they had ever reported experiencing another form of homelessness
- 'Not homeless' if neither rough sleeping nor other homeless applies – limited to clients being at risk of homelessness
- 'Not stated' if housing situation is missing or unknown.
Last known housing situation
The housing situation at the end of the support period that ended the closest to the client's death is reported as the last known housing situation. If this housing situation was unknown, the last known housing situation from the week before, the start or the end any support period up to six months earlier than the end of the last support period is reported. If the last known housing situation was more than 6 months prior to end of the last support period, the housing situation for the client is reported as not stated.
Sex
Sex is based on the sex reported to Medicare. If this was not available, the most frequently reported sex in the SHSC for a client was assigned; if there was not a dominant proportion, the client was based on the sex that was recorded for their most recent SHS activity. Sex was missing for some records; the sum of males and females may not add to the total.
Due to data quality issues as well as confidentiality concerns, those clients identifying as Sex = Other have been included in the ‘Female’ category.
ABS (Australian Bureau of Statistics) (2024) Listing of psychosocial risk factor ICD-10 codes with inclusions and exclusions, ABS, Australian Government, accessed 3 September 2025.
AIHW (Australian Institute of Health and Welfare) (2022) Social determinants of health, AIHW, Australian Government, accessed 7 July 2025.
AIHW (Australian Institute of Health and Welfare) (2024b) Specialist Homelessness Services: feature analysis: SHS: trends in clients rough sleeping, AIHW, Australian Government, accessed 10 July 2025.
AIHW (Australian Institute of Health and Welfare) (2024c) Australian Health Performance Framework: PI 2.1.6–Potentially avoidable deaths (METEOR ID 801261) AIHW METEOR Metadata Online Registry website, accessed 14 July 2025.
Box E, Flatau P, Lester L (2022) ‘Women sleeping rough: The health, social and economic costs of homelessness’, Health and Social Care in the Community, 30(6): e4175–e4190, doi: 10.1111/hsc.13811
Bullen J (2019) ‘Didn’t feel heard, didn’t think I had a voice, didn’t feel safe’: Gender responsive strategies for assisting women experiencing long-term and recurrent homelessness’, Parity, 32(3), 33–35.
Gordon SJ, Baker N, Marin TS, Steffens M (2025) ‘Health Deficits Among People Experiencing Homelessness in an Australian Capital City: An Observational Study’, International Journal of Environmental Research and Public Health, 22(2):135, doi: 10.3390/ijerph22020135
Seastres RJ, Hutton J, Zordan R, Moore G, Mackelprang J, Kiburg KV, Sundararajan V (2020) ‘Long-term effects of homelessness on mortality: a 15-year Australian cohort study’, Australian and New Zealand Journal of Public Health, 44(6):476–481, doi: 10.1111/1753-6405.13038
Tuson M, Vallesi S, Wood L (2024) ‘Tracking deaths of people who have experienced homelessness: a dynamic cohort study in an Australian city’, BMJ Open, 14(3):e081260, doi: 10.1136/bmjopen-2023-081260
WHO (World Health Organization) (2024) Social determinants of health, WHO, accessed 10 April 2024
Zordan R, Mackelprang JL, Hutton J, Moore G, Sundararajan V (2023) ‘Premature mortality 16 years after emergency department presentation among homeless and at risk of homelessness adults: a retrospective longitudinal cohort study’, International Journal of Epidemiology, 52(2):501–511, doi: 10.1093/ije/dyad006
Amendments
16 December 2025 – a correction was made to the key finding about potential years of life lost. The text previously referred to ‘people who died in the last year of life’, which has been changed to ‘people who received SHS support in the last year of life’.