
Admitted patient care
Admission to hospital is a formal process. It follows a medical officer's decision that a patient needs to be admitted for appropriate management or treatment of their condition, and/or for appropriate care or assessment of their needs.
Admitted patient services are either provided on a same-day basis or can involve a stay in hospital overnight or longer.
How much activity was there?
The main measure of admitted patient care provided in Australian hospitals is the number of hospitalisations, or episodes of admitted patient care. Because hospitalisations can vary in length, another useful measure is patient days, or the total number of days spent in hospital by patients, or days of patient care.
Hospitalisations
Between 2010–11 and 2014–15:
- the number of hospitalisations increased by an average of 3.2% in public hospitals and 4.0% in private hospitals each year
- overall, the number of hospitalisations increased an average of 3.5% each year, faster than the population growth of 1.6% over the same period
- same-day hospitalisations increased by an average of 4.3% each year, compared with 2.4% for overnight hospitalisations.
In 2014–15, there were almost 10.2 million hospitalisations in Australia (Table 4):
- 60% of these were same-day hospitalisations (6.0 million)
- 59% occurred in public hospitals (6.0 million), and just over half of these (3.1 million) were same-day hospitalisations
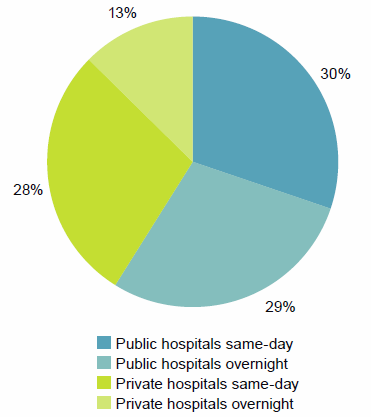
- 41% occurred in private hospitals (4.2 million), and over two-thirds of those (2.9 million) were same-day hospitalisations (Figure 15).
Figure 15: Same-day and overnight hospitalisations, public and private hospitals, 2014–15
| Public and private hospitals | NSW | Vic | Qld | WA | SA | Tas | ACT | NT | Total |
|---|---|---|---|---|---|---|---|---|---|
| Public hospitals | |||||||||
| Public acute hospitals | 1,809 | 1,588 | 1,202 | 599 | 421 | 118 | 101 | 132 | 5,971 |
| Public psychiatric hospitals | 5 | <1 | <1 | 1 | 1 | 1 | .. | .. | 10 |
| Total public hospitals | 1,814 | 1,588 | 1,203 | 601 | 422 | 120 | 101 | 132 | 5,980 |
| Private hospitals | |||||||||
| Private free-standing day hospital facilities | 255 | 223 | 228 | 144 | 76 | n.p. | n.p. | n.p. | 941 |
| Other private hospitals | 930 | 786 | 805 | 337 | 240 | n.p. | n.p. | n.p. | 3,229 |
| Total private hospitals | 1,185 | 1,009 | 1,033 | 481 | 316 | n.p. | n.p. | n.p. | 4,170 |
| All hospitals | 2,999 | 2,597 | 2,236 | 1,081 | 738 | 208 | 145 | 146 | 10,150 |
.. not applicable, n.p. not published.
How does Australia compare?
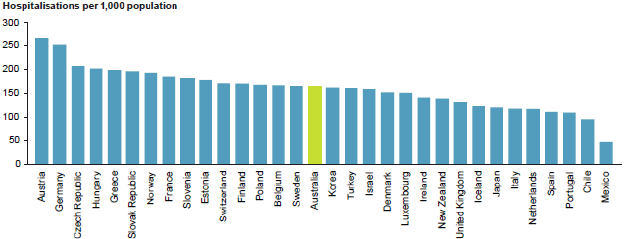
The number of overnight hospitalisations per 1,000 population in Australia for 2014–15 was in the middle of the range reported for other Organisation for Economic Co-operation and Development (OECD) countries in recent years (Figure 16) (OECD 2015).
Differences in definitions of hospitals, collection periods and admission practices are likely to affect the comparability of international separation rates.
For more international comparisons, see Chapter 2 of Admitted patient care 2014–15: Australian hospital statistics (AIHW 2016a).
Figure 16: Overnight hospitalisations per 1,000 population, Australia (2014–15) and selected OECD countries
Days of patient care
Between 2010–11 and 2014–15:
- the number of patient days increased by an average of 1.7% each year—from 26.9 million to 28.8 million
- the number of patient days in public hospitals increased an average of 1.2% per year, and the proportion of patient days that were in public hospitals decreased from 69% to 67%
- the number of patient days in private hospitals increased an average of 2.8% per year, and the proportion of patient days that were in private hospitals increased from 31% to 33%.
In 2014–15, 3% of patient days in public hospitals were spent in Public psychiatric hospitals (Table 5).
For more information on patient days, see Chapter 2 of Admitted patient care 2014–15: Australian hospital statistics (AIHW 2016a).
| Public and private hospitals | NSW | Vic | Qld | WA | SA | Tas | ACT | NT | Total |
|---|---|---|---|---|---|---|---|---|---|
| Public hospitals | |||||||||
| Public acute hospitals | 6,353 | 4,794 | 3,377 | 1,752 | 1,475 | 368 | 344 | 324 | 18,787 |
| Public psychiatric hospitals | 264 | 46 | 148 | 56 | 38 | 24 | .. | .. | 577 |
| Total public hospitals | 6,617 | 4,840 | 3,525 | 1,808 | 1,513 | 392 | 344 | 324 | 19,364 |
| Private hospitals | |||||||||
| Private free-standing day hospital facilities | 255 | 224 | 228 | 144 | 76 | n.p. | n.p. | n.p. | 941 |
| Other private hospitals | 2,397 | 2,209 | 2,150 | 804 | 568 | n.p. | n.p. | n.p. | 8,449 |
| Total private hospitals | 2,652 | 2,432 | 2,378 | 948 | 644 | n.p. | n.p. | n.p. | 9,390 |
| All hospitals | 9,269 | 7,272 | 5,903 | 2,756 | 2,158 | n.p. | n.p. | n.p. | 28,754 |
.. not applicable, n.p. not published.
Length of stay
Between 2010–11 and 2014–15, average lengths of stay for public and private hospitals fell slightly:
- from 3.5 to 3.2 days in public hospitals—an annual average decrease of 1.9%
- from 2.4 to 2.3 days in private hospitals—an annual average decrease of 1.1%.
In 2014–15, the average length of stay was generally higher for subacute and non-acute care than for acute care. The average length of stay was:
- 2.7 days in public hospitals and 2.1 days in private hospitals for acute care
- 17.4 days in public hospitals and 4.4 days in private hospitals for rehabilitation care, for example (Figure 17).
For patients who spent at least 1 night in hospital, the average length of stay was 5.7 days in public hospitals and 5.2 days in private hospitals
For more information on length of stay, see chapters 2 and 4 of Admitted patient care 2014–15: Australian hospital statistics (AIHW 2016a).
Figure 17: Average length of stay (days) by care type, public and private hospitals, 2014–15

Performance indicator: relative stay index
Relative stay indexes summarise the length of stay for admitted patients, with adjustments for 'casemix' (the types of patients treated and the types of treatments provided). They are regarded as indicators of the efficiency of hospitals.
A relative stay index greater than 1.0 indicates that an average patient's length of stay is higher than expected, given the casemix for the hospitalisations being considered. A relative stay index of less than 1.0 indicates that the length of stay was less than expected.
In 2014–15, the relative length of stay for public hospitals was lower than that for private hospitals. This has been a consistent trend since 2010–11.
There were relatively shorter lengths of stay for Medical hospitalisations in public hospitals (0.94, compared with 1.28 in private hospitals), and for Surgical hospitalisations in private hospitals (0.99, compared with 1.03 in public hospitals) (Figure 18).
For more information on relative stay indexes, see Chapter 2 of Admitted patient care 2014–15: Australian hospital statistics (AIHW 2016a).
Figure 18: Relative stay index (directly standardised), for medical, surgical and other care, public and private hospitals, 2014–15
, and for Surgical hospitalisations in private hospitals (0.99, compared with 1.03 in public hospitals). Data for this figure are available in Chapter 2 of Admitted patient care 2014-15: Australian hospital statistics.")
Performance indicator: average length of stay for selected types of hospitalisations
The average length of stay for selected types of hospitalisations is regarded as an indicator of the efficiency of hospitals.
There were notable differences (more than 1 day) in the average length of stay between public and private hospitals for 8 of the 20 selected types of hospitalisations. For example, the average length of stay for Chronic obstructive airways disease was 3.9 days for public hospitals and 7.1 days for private hospitals. The average lengths of stay were also notably longer in private hospitals for childbirth and neonate-related hospitalisations and for Kidney and urinary tract infections.
In contrast, for example, there was little difference in the average lengths of stay for Tonsillectomy and/or adenoidectomy, Hernia procedures, Retinal procedures, and Knee replacement.
For more information on length of stay, see Chapter 2 of Admitted patient care 2014–15: Australian hospital statistics.
Figure 19: Average length of stay for selected types of hospitalisations, public and private hospitals, 2014–15
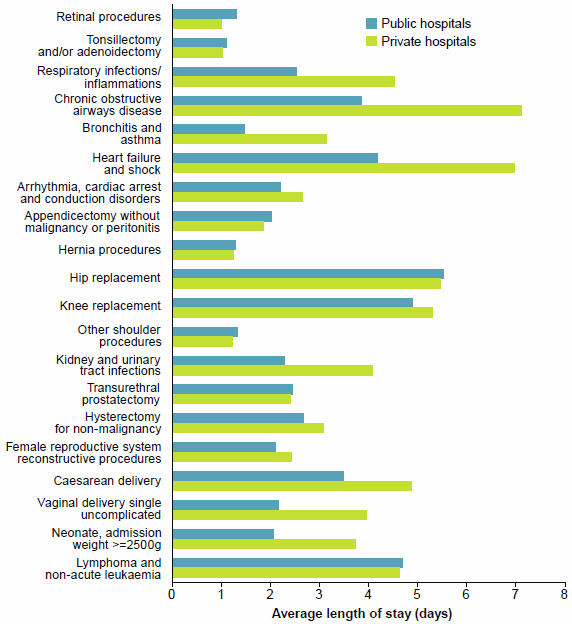
Note: The average lengths of stay were compared for episodes without complications and comorbidities.
Who used admitted patient care services?
Age group and sex
Between 2010–11 and 2014–15:
- hospitalisations for people aged 65 to 74 increased by an average of 6.0% each year, faster than the population growth for this age group which was about 4.6% each year over the same period
- hospitalisations for people aged 85 and over increased by an average of 5.8% each year, faster than the population growth for this age group which was about 4.1% each.
In 2014–15, there were over 5.3 million hospitalisations for females and 4.8 million hospitalisations for males Females accounted for about 65% of hospitalisations for people aged 15 to 44.
People aged 65 and over, who make up 15% of Australia's population, accounted for 41% of hospitalisations (Figure 20) and 49% of patient days.
Figure 20: Hospitalisations, by age group and sex, 2014–15

Aboriginal and Torres Strait Islander people
In 2014–15, compared with other Australians, Aboriginal and Torres Strait Islander people were hospitalised:
- at more than twice the rate (after accounting for age)
- almost 2 times as often for overnight stays (Figure 21)
- almost 3 times as often for same-day care.
However, if same-day dialysis is excluded, Indigenous Australians were hospitalised for same-day care at a lower rate than other Australians.
Figure 21: Hospitalisations per 1,000 population, by Indigenous status, 2014–15

Remoteness
Remoteness area categories divide Australia into areas depending on distances from population centres. Access to services can be measured by the number of hospitalisations per 1,000 population for these areas.
In 2014–15:
- overall, hospitalisation rates were highest for persons living in Very remote areas
- for public hospitals, the rates were highest for patients living in Very remote areas and lowest for patients living in Major cities (Figure 22)
- for private hospitals, the rates were highest for patients living in Major cities and lowest for patients living in Very remote areas
- for patients who stayed at least one night in hospital, the hospitalisation rate for patients living in Very remote areas was 60% higher than the national rate.
Figure 22: Hospitalisations per 1,000 population, by remoteness area of usual residence, public and private hospitals, 2014–15

Socioeconomic status
Data describing where patients live can be used to derive an approximation of their socioeconomic status which, in turn, can be categorised into five equal population groups of socioeconomic disadvantage/advantage. If use of admitted patient services is equal for all socioeconomic status groups, we would expect an equal number of hospitalisations for each group.
Overall, hospitalisation rates varied across socioeconomic status groups. In 2014–15:
- for public hospitals, the rates were highest for patients living in areas classified in the lowest socioeconomic status group (Figure 23)
- for private hospitals, the rates were highest for patients living in areas classified in the highest socioeconomic status group.
Figure 23: Hospitalisations per 1,000 population, by socioeconomic status of area of usual residence, public and private hospitals, 2014–15

Why did people receive care?
The reason that a patient receives admitted patient care can be described in a number of ways. These include how people are admitted to hospital, the urgency of admission, the type of care required and the principal diagnosis.
How people are admitted to hospital
There are 3 different modes of admission to hospital:
- Admitted patient transferred from another hospital
- Statistical admission: care type change, that is, where a new admitted patient episode is created as a result of a change of clinical intent of care, for example from acute care to rehabilitation or palliative care, within the same hospital
- New admission to hospital (all other planned and unplanned admissions where a patient was not transferred from another hospital or did not have a Statistical admission: care type change in the same hospital).
In 2014–15:
- 94% of hospitalisations in public hospitals and 96% in private hospitals were New admissions to hospital
- 4.7% of patients in public hospitals were transferred from another hospital compared with 3.0% in private hospitals.
Urgency of admission
Admissions to hospital can be categorised as Emergency (required within 24 hours), or Elective (required at some stage beyond 24 hours). Urgency is not assigned for some admissions (for example, obstetric care and planned care, such as dialysis).
Between 2010–11 and 2014–15:
- emergency admissions in public hospitals increased by an average 3.4% each year compared with 2.2% in private hospitals
- elective admissions in private hospitals increased by an average of 4.1% each year, compared with 2.5% in public hospitals.
In 2014–15:
- public hospitals accounted for about 92% of emergency admissions, and 73% of these were overnight admissions
- private hospitals accounted for 59% of elective admissions, and 72% of these were overnight admissions (Figure 24).
For more information see Chapter 4 of Admitted patient care 2014–15: Australian hospital statistics (AIHW 2016a).
Figure 24: Hospitalisations by same-day/overnight status and urgency of admission, public and private hospitals 2014–15

Care type
The care type can be classified as:
- acute care, or
- subacute and non-acute care (such as Rehabilitation, Palliative care, Geriatric evaluation and management, Maintenance care and Psychogeriatric care).
Most hospitalisations are for acute care, that is, care with the intent to cure the condition, alleviate symptoms or manage childbirth, and newborns but only if they also require acute care.
Between 2010–11 and 2014–15:
- the care types with the highest average increase each year were Newborn in public hospitals and Rehabilitation care in private hospitals
- the number of hospitalisations for acute care increased on average by 3.0% each year for public hospitals and by 3.5% for private hospitals
- rehabilitation accounted for an increasing proportion of all subacute and non-acute care hospitalisations, rising from 76% in 2010–11 to 79% in 2014–15.
In 2014–15:
- there were 9.5 million acute care hospitalisations that accounted for:
- subacute and non-acute care accounted for 5% of all hospitalisations and 17% of patient days.
Figure 25: Hospitalisations by care type, public and private hospitals, 2014–15

Figure 26: Patient days by care type, public and private hospitals, 2014–15

Why did people go to hospital?
The reason that a patient receives admitted patient care can be described in terms of a principal diagnosis (of a disease, injury or poisoning) or as a treatment for an ongoing condition (for example, dialysis for kidney failure).
In 2014–15:
- there were 1.4 million hospitalisations for dialysis and 99% of these were same-day
- there were 1.1 million hospitalisations related to cancer, 640,000 had a principal diagnosis of cancer and an additional 440,000 were for chemotherapy
- 89% of hospitalisations for digestive system diseases involved surgery and 41% involved an endoscopy.
For more information about common principal diagnoses, see the info graphic page.
For more information on principal diagnoses for same-day and overnight acute hospitalisations see Chapter 4 of Admitted patient care 2014–15: Australian hospital statistics (AIHW 2016a).
Injury and poisoning
In 2014–15, 6.4% of hospitalisations (651,000) were for injury or poisoning. The majority (82%) were treated in public hospitals. About 44% of these were for injuries to arms and legs.
Indigenous Australians were hospitalised for injury or poisoning at about twice the rate for other Australians.
Performance indicator: potentially preventable hospitalisations
Potentially preventable hospitalisations are hospitalisations that are thought to have been avoidable if timely and adequate non-hospital care had been provided, either to prevent the condition occurring, or to prevent the hospitalisation for the condition. They are identified based on the diagnoses reported for admitted patients and divided into three categories—vaccine-preventable, acute and chronic conditions.
Between 2010–11 and 2014–15:
- the overall rate of potentially preventable hospitalisations fluctuated between 23.9 and 25.2 per 1,000 population
- rates of vaccine-preventable hospitalisations increased from 0.7 to 1.8 per 1,000 population
- for chronic conditions, the rate fluctuated around 11.4 per 1,000.
In 2014–15:
- 634,000 hospitalisations were thought to be potentially preventable—6.2% of all hospitalisations
- for Indigenous Australians, the overall rate of potentially preventable hospitalisations per 1,000 population was around 3 times the rate for other Australians
- people living in Very remote areas had the highest rates of potentially preventable hospitalisations for chronic and acute conditions
- the overall rate generally decreased with increasing levels of socioeconomic advantage (Figure 27).
For more information on potentially preventable hospitalisations, see Chapter 4 of Admitted patient care 2014–15: Australian hospital statistics (AIHW 2016a).
Figure 27: Potentially preventable hospitalisations by remoteness area of usual residence, all hospitals, 2014–15

Performance indicator: waiting for residential aged care
This indicator reports the number of hospital patient days for Australians eligible and waiting for a residential aged care place.
In 2014–15:
- about 10 out of every 1,000 patient days (1%) reported were for patients waiting for a residential aged care place
- the highest rates were reported for patients living in Remote areas and for those living in areas classified to the two most disadvantaged socioeconomic status groups.
Infographic
Infographic: Why did people go to hospital in 2014–15? (412KB PDF A3 sized) | (2KB TXT)
What services were provided?
The broad nature of services provided for admitted patients can be described using a variety of classifications. The information presented here includes:
- broad category of service, including hospitalisations for Childbirth, Specialist mental health care, Medical (not involving a procedure), Surgical (involving an operating room procedure) or a non-surgical procedure, such as endoscopy (Other)
- intensive care
- the intent of care—including information for Rehabilitation and Palliative care.
Broad category of service
Between 2010–11 and 2014–15, Specialist mental health hospitalisations increased for both public and private hospitals (by an average of 4.5% and 7.2% each year, respectively).
In 2014–15:
- 71% of public hospitalisations were for Medical care and 3.7% were for Childbirth (Figure 28)
- 36% of private hospitalisations were for Surgical care and 1.8% were for Childbirth.
Figure 28: Hospitalisations (%) by broad category of service, public and private hospitals, 2014–15

Intensive care
An intensive care unit can provide complex, multi-system life support. These units are mostly located in tertiary referral centres and can provide continuous mechanical ventilation, extracorporeal renal support and invasive cardiac monitoring for children or adults.
In 2014–15:
- overall, just under 1.3% of hospitalisations (131,000) involved a stay in an intensive care unit (information about intensive care hours was not available for 1.3 million private hospitalisations)
- 30,000 hospitalisations in private hospitals involved a stay in an intensive care unit, and 16% of these included a period of ventilator support
- 101,000 hospitalisations in public hospitals involved a stay in an intensive care unit and 32% of these included a period of ventilator support
- the average length of stay in an intensive care unit was almost 4 days in public hospitals and just over 2 days in private hospitals.
Rehabilitation care
Rehabilitation care is aimed at improved functioning. It accounted for 1.7% of hospitalisations and 8.8% of patient days for public hospitals, and 7.4% of hospitalisations and almost 14.0% of patient days for private hospitals.
Between 2010–11 and 2014–15, Rehabilitation care increased by an average of 12.0% per year in private hospitals and by 4.4% per year in public hospitals.
In 2014–15:
- 413,000 hospitalisations were reported for Rehabilitation care, with 75% occurring in private hospitals
- the most common reasons for Rehabilitation care were osteoarthritis of the knee and hip
- about 80% of hospitalisations for Rehabilitation care were for people aged over 60.
Palliative care
Palliative care is care in which the primary clinical purpose or treatment goal is to optimise the quality of life of a patient with an active and advanced life-limiting illness.
Between 2010–11 and 2014–15, Palliative care increased by an average of 3.1% per year for private hospitals and 5.2% for public hospitals.
In 2014–15:
- there were almost 41,000 hospitalisations for Palliative care (0.4% of hospitalisations)
- Indigenous Australians had a higher hospitalisation rate for Palliative care (2.6 per 1,000 population) than other Australians (1.5 per 1,000 population)
- the rate of Palliative care in public hospitals varied among socioeconomic status groups— from 0.9 per 1,000 population for people living in areas classified as the highest socioeconomic status group to 1.5 per 1,000 for people living in areas classified as being in the lowest socioeconomic status group
- 59% of Palliative care hospitalisations had a principal diagnosis that was related to cancer
- other common principal diagnoses included heart failure and respiratory disorders.
What procedures were performed?
Procedures reported for admitted patients can include surgical procedures, non-operating room procedures, procedures of a patient support nature and other interventions.
Haemodialysis is the most common procedure reported by Australian hospitals. Between 2010–11 and 2014–15, the number of procedures reported for Haemodialysis increased by an average of 3.6% each year, rising from 1.2 million to almost 1.4 million.
In 2014–15:
- about 20.3 million procedures were reported—10.4 million in public hospitals and 9.9 million in private hospitals
- about 75% of public hospital hospitalisations and 95% of private hospital hospitalisations involved a procedure
- public hospitals accounted for 73% of Procedures on the urinary system (mainly for dialysis), 76% of Radiation oncology procedures, 75% of Procedures on the respiratory system and 74% of Obstetric procedures (including for childbirth)
- private hospitals accounted for 71% of Dental services procedures and 75% of Procedures on the eye and adnexa (including cataract surgery).
For more information on surgical procedures, see the section 'Surgery in Australia's hospitals' in this report and Chapter 6 of Admitted patient care 2014–15: Australian hospital statistics (AIHW 2016a).
Performance indicator: rates of selected hospital procedures
The rates for these hospital procedures are presented as an indicator of appropriateness and may also be indicators of accessibility of care.
Figure 29 presents hospitalisations per 1,000 population for selected hospital procedures. The national rate is accompanied by the range of rates for these procedures for states and territories. There was some variation among states and territories for the selected procedures: for example, the national rate for cataract extraction was 9.3 per 1,000 population, but the state/territory rate ranged from 5.7 to 10.9 per 1,000 population.
Figure 29: Hospitalisations per 1,000 population for selected hospital procedures, all hospitals, 2014–15

What was the safety and quality of the care?
Some information is available on the safety and quality of admitted patient care in hospitals, but this does not provide a complete picture. There is no routinely available information on some aspects of quality, such as the continuity and responsiveness of hospital services.
Performance indicator: adverse events
Adverse events are defined as incidents in which harm resulted to a person receiving health care. They include infections, falls resulting in injuries, and problems with medication and medical devices. Some of these adverse events may be preventable.
In 2014–15:
- 1 or more adverse events resulted in, or affected about 569,000 hospitalisations (5.6% of all hospitalisations) (Table 6)
- about 6.7% of hospitalisations in public hospitals and 4.1% in private hospitals had an adverse event recorded; the differences may reflect the different casemixes of public and private hospitals.
The proportion of hospitalisations for which an adverse event was reported was generally higher for:
- overnight hospitalisations compared with same-day hospitalisations (11.3% and 1.8%, respectively)
- subacute and non-acute care (for which lengths of stay are typically longer) compared with acute care hospitalisations (10.1% and 5.4%, respectively)
- emergency admissions compared with non-emergency admissions (9.9% and 4.0%, respectively).
| Hospitalisations | Public hospitals |
Private hospitals |
Total |
|---|---|---|---|
| Hospitalisations with an adverse event | 400,035 | 169,383 | 569,418 |
| Hospitalisations with an adverse event per 100 hospitalisations | |||
| Same-day hospitalisations | 2.0 | 1.4 | 1.8 |
| Overnight hospitalisations | 11.8 | 10.2 | 11.3 |
| Acute care hospitalisations | 6.4 | 3.8 | 5.4 |
| Subacute and non-acute care hospitalisations | 15.5 | 6.8 | 10.1 |
| Emergency admission | 9.7 | 12.3 | 9.9 |
| Non-emergency admission | 4.5 | 3.6 | 4.0 |
| Total | 6.7 | 4.1 | 5.6 |
For more information on hospitalisations with adverse events, see Chapter 8 of Admitted patient care 2014–15: Australian hospital statistics (AIHW 2016a).
Performance indicator: falls resulting in patient harm in hospital
In 2014–15, a fall resulting in harm (that occurred in a health service area) was reported for more than 33,000 hospitalisations
- a higher rate of falls was reported for public hospitals than for private hospitals (4.2 and 1.6 per 1,000 hospitalisations, respectively)
- a lower rate of falls was reported for Indigenous Australians than for other Australians (1.5 and 3.4 per 1,000 hospitalisations, respectively)
- patients living in Major cities had a higher rate of falls than those living in Remote and Very remote areas (3.4 and 1.9 per 1,000 hospitalisations, respectively).
Performance indicator: unplanned readmissions
Unplanned or unexpected readmissions within 28 days of surgery are identified as those with a principal diagnosis related to an adverse event.
In 2014–15:
- rates of unplanned or unexpected readmissions were highest for Tonsillectomy and adenoidectomy, Prostatectomy and Hysterectomy
- for Cataract extraction, 3 per 1,000 hospitalisations were followed by a readmission within 28 days (Figure 30).
For more information on unplanned or unexpected readmissions, see Chapter 8 of Admitted patient care 2014–15: Australian hospital statistics (AIHW 2016a).
Figure 30: Unplanned or unexpected readmissions within 28 days of selected surgical procedures, public hospitals, 2014–15

Performance indicator: healthcare-associated infections—Staphylococcus aureus bacteraemia in public hospitals
The rate of Staphylococcus aureus bacteraemia (SAB), also known as golden staph bloodstream infection, is an important measure of the safety of hospital care. The aim is to have as few cases of SAB as possible. One of the most effective ways to minimise the risk of SAB and other healthcare-associated infections is good hand hygiene.
Between 2010–11 and 2014–15, the overall number of SAB cases decreased from 1,876 to 1,490. The number of methicillin-sensitive cases (MSSA), which would have been treatable with commonly used antibiotics, decreased from 1,371 to 1,159 and the number of methicillin-resistant cases (MRSA) decreased from 505 to 331 (Figure 31).
In 2014–15:
- 1,490 cases were reported for public hospitals over 19.5 million days of patient care under surveillance
- all states and territories had SAB rates below the national benchmark of 2.0 cases per 10,000 days of patient care
- more than three-quarters of SAB cases were methicillin-sensitive.
For more information, see Staphylococcus aureus bacteraemia in Australian public hospitals 2014–15: Australian hospital statistics (AIHW 2015d).
Figure 31: Cases of Staphylococcus aureus bacteraemia 2010–11 to 2014–15
, which would have been treatable with commonly used antibiotics, decreased from 1,371 to 1,159 and the number of methicillin-resistant cases (MRSA) decreased from 505 to 331 Data for this figure are available in Chapter 8 of Admitted patient care 2014-15: Australian hospital statistics.")
How was the care completed?
Overall, about 92% of admitted patients were discharged home (to their place of usual residence) at the end of their episode of care. A small proportion of hospitalisations (less than 4%) were transferred to some other health care accommodation, including another hospital. Fewer than 1% died in hospital.
In 2014–15, 95% of hospitalisations in private hospitals were discharged home compared with 89% in public hospitals. However, a larger proportion of hospitalisations from public hospitals were discharged to some other health care accommodation, including another acute or psychiatric hospital, residential aged care or other health care accommodation.
For more information about how the care was completed, see Chapter 5 of Admitted patient care 2014–15: Australian hospital statistics (AIHW 2016a).
References
Australian Institute of Health and Welfare (AIHW) 2015d.Staphylococcus aureus bacteraemia in Australia's public hospitals 2014–15: Australian hospital statistics Health services series no. 67. Cat no. HSE 171. Canberra: AIHW.
AIHW 2016a: Admitted patient care 2014–15: Australian hospital statistics. Health services series no. 68. Cat. no. HSE 172. Canberra: AIHW.