Surgery in Australia’s hospitals
In 2014–15:
- about 1 in 4 (24%) hospitalisations involved surgery (2.5 million)
- about 60% of hospitalisations involving surgery occurred in private hospitals.
Admissions involving surgery can be described as emergency or elective (non-emergency).
An emergency admission involving surgery is an acute care hospitalisation that included a surgical procedure for which the urgency of admission was reported as Emergency—indicating that the patient required admission within 24 hours
An elective admission involving surgery is an acute care hospitalisation that included a surgical procedure for which the urgency of admission was reported as Elective—indicating that the admission could be delayed.
Emergency surgery
Between 2010–11 and 2014–15, the number of emergency admissions involving surgery increased by an average of 2.9% each year.
In 2014–15:
- there were about 314,000 emergency admissions involving surgery
- public hospitals accounted for 87% of emergency admissions involving surgery
- the average length of stay for overnight emergency admissions involving surgery was 7.6 days
- nationally, there were 13 emergency admissions involving surgery per 1,000 population, ranging from 12 per 1,000 population in New South Wales to 15 per 1,000 in South Australia
- the 3 most common reasons for an emergency admissions involving surgery were appendicitis, hip fracture and heart attack (acute myocardial infarction).
Elective surgery
Between 2010–11 and 2014–15:
- the number of elective admissions involving surgery rose by an average of 2.4% each year.
- this rise was higher in private hospitals (3.0%) than public hospitals (1.3%).
In 2014–15:
- there were over 2.1 million elective admissions involving surgery in Australia's public and private hospitals
- public hospitals provided 29 elective admissions involving surgery per 1,000 population and private hospitals provided 58 per 1,000
- the average length of stay for overnight elective admissions involving surgery was 3.6 days in public hospitals and 3.1 days in private hospitals
- the 3 most common reasons for an elective admissions involving surgery were cataracts, malignant skin lesions and procreative management (in vitro fertilisation procedures).
For more information on admissions involving surgery, see Chapter 6 of Admitted patient care 2014–15: Australian hospitals statistics (AIHW 2016a).
How many patients were admitted from elective surgery waiting lists?
Between 2010–11 and 2014–15, the number of admissions from public hospital elective surgery waiting lists increased by an average of 2.2% each year, and it decreased by 0.6% between 2013–14 and 2014–15.
In 2014–15, almost 698,000 patients were admitted from public hospital elective surgery waiting lists (Table 7).
Performance indicator: waiting times for elective surgery
Waiting times for elective surgery are an indicator of the provision of timely care.
In 2014–15:
- 50% of patients who had been placed on a public hospital elective surgery waiting list waited 35 days or less to be admitted for their surgery. Median waiting times have remained constant at 36 days between 2010–11 and 2013–14 and decreased to 35 days in 2014–15
- 50% of patients waiting for a coronary artery bypass graft were admitted within 14 days
- 50% of patients waiting for septoplasty were admitted after 214 days
- 50% of patients waiting for a total knee replacement were admitted within 191 days (Figure 32)
- the median waiting time varied between states and territories, ranging from 27 days in Queensland to 55 days in Tasmania (Table 7)
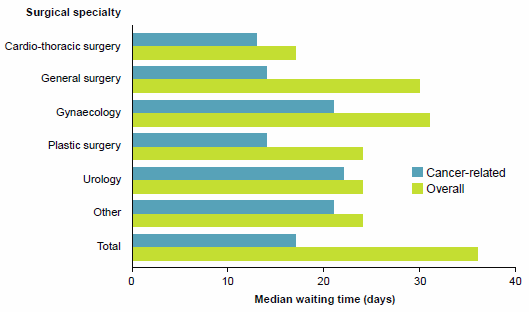
- patients with cancer-related principal diagnoses had shorter waiting times (50% admitted within 17 days) compared with patients overall (50% admitted within 36 days) (Figure 33)
- 1.8% of patients waited more than 1 year.
For more information on surgery in Australia's hospitals, see 'Performance indicator: Rates of selected hospital procedures' and 'Performance indicator: Unplanned readmissions' in this report, and Chapter 3 of Elective surgery waiting times 2014–15: Australian hospital statistics (AIHW 2015b).
| Admission and Waiting time | NSW | Vic | Qld | WA | SA | Tas | ACT | NT | Total |
|---|---|---|---|---|---|---|---|---|---|
| Total admissions ('000) | 218 | 173 | 126 | 83 | 62 | 16 | 12 | 8 | 698 |
| Waiting time statistics | |||||||||
| 50th percentile time to admission (days) | 54 | 29 | 27 | 29 | 37 | 55 | 45 | 32 | 35 |
| 90th percentile time to admission (days) | 330 | 177 | 147 | 148 | 210 | 424 | 245 | 217 | 253 |
| Per cent waited more than 365 days (%) | 1.6 | 2.4 | 0.5 | 0.7 | 1.1 | 12.9 | 5.3 | 3.9 | 1.8 |
Figure 32: Median waiting times for elective surgery, by procedure, public hospitals, 2014–15

Note: Surgical specialties for which there were fewer than 50 admissions for cancer-related principal diagnoses are not shown.
Figure 33: Median waiting times, overall and cancer-related, by specialty of surgeon, public hospitals, 2014–15

References
Australian Institute of Health and Welfare (AIHW) 2015b: Emergency department care 2014–15: Australian hospital statistics. Health services series no. 65. Cat. no. HSE 168. Canberra: AIHW.
AIHW 2016a: Admitted patient care 2014–15: Australian hospital statistics. Health services series no. 68. Cat. no. HSE 172. Canberra: AIHW.


