Emergency department services
Emergency departments provide care for patients who may have an urgent need for medical, surgical or other care. Most emergency department services (93%) are provided by public hospitals. In 2014–15, 37 private hospitals reported about 533,000 accident and emergency presentations (ABS 2016).
Public hospitals
Between 2010–11 and 2014–15, emergency department presentations increased by 3.4% on average each year, after adjusting for coverage changes.
In 2014–15, there were almost 7.4 million emergency department presentations in public hospitals—that is, about 20,000 presentations each day.
Who used these services?
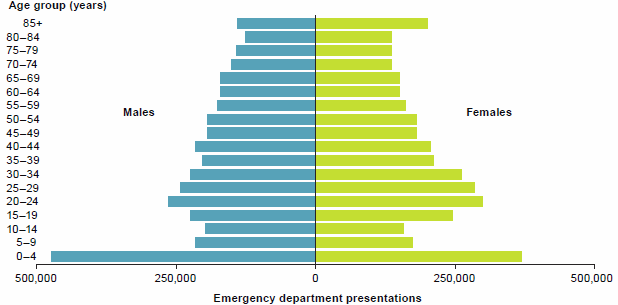
In 2014–15, 51% of emergency department presentations were for males (Figure 9), who account for just under 50% of the population.
The most common age group reported for emergency department presentations was 0–4 years (11%), followed by 20–24 years (8%).
People aged 65 and over accounted for about 20% of all emergency department presentations in 2014–15, although they account for about 15% of the population.
How did people arrive and how urgent was the care?
Most people presenting to emergency departments had an arrival mode of Other (meaning they walked in to the emergency department or came by private transport, public transport, community transport or taxi). About 24% arrived by Ambulance, air ambulance or helicopter rescue service.
When patients arrive at an emergency department they are assigned a triage category of either Resuscitation (should be treated immediately), Emergency (within 10 minutes), Urgent (within 30 minutes), Semi-urgent (within 60 minutes) or Non-urgent (within 120 minutes).
In 2014–15, 77% of patients were assessed as Urgent or Semi-urgent. Fewer than 1% of patients required immediate treatment.
Figure 9: Emergency department presentations, by age group and sex, public hospital emergency departments, 2014–15

Performance indicator: waiting times for emergency hospital care—proportion seen on time
The proportion of emergency presentations that were seen on time increased from 70% to 75% between 2010–11 and 2013–14, and was 74% in 2014–15.
The proportion seen on time varied among jurisdictions, ranging from 59% in the Australian Capital Territory to 81% in New South Wales (Table 3).
Almost 100% of Resuscitation patients were seen immediately (within 2 minutes), 79% of Emergency patients were seen within 10 minutes, and 92% of Non-urgent patients were seen on time (within 120 minutes).
For more information, see Chapter 5 of Emergency department care 2014–15: Australian hospital statistics (AIHW 2015b).
| Triage category and Presentations |
NSW | Vic | Qld | WA | SA | Tas | ACT | NT | Total |
|---|---|---|---|---|---|---|---|---|---|
| Total presentations ('000) | 2,681 | 1,611 | 1,379 | 804 | 469 | 150 | 130 | 142 | 7,366 |
| Triage category (%) | |||||||||
| Resuscitation | 100 | 100 | 99 | 100 | 100 | 100 | 100 | 100 | 100 |
| Emergency | 82 | 80 | 77 | 83 | 69 | 83 | 78 | 62 | 79 |
| Urgent | 76 | 73 | 64 | 57 | 57 | 64 | 48 | 54 | 68 |
| Semi-urgent | 81 | 73 | 74 | 69 | 69 | 67 | 53 | 59 | 74 |
| Non-urgent | 95 | 89 | 93 | 93 | 89 | 89 | 86 | 88 | 92 |
| Total | 81 | 75 | 71 | 68 | 66 | 70 | 59 | 60 | 74 |
How was the care completed?
Most patients who go to the emergency department go home after treatment (64%), but almost 1 in 3 patients (30%) were admitted to hospital for further care.
In 2014–15, about 77% of Resuscitation patients were subsequently admitted compared with fewer than 5% of Non-urgent patients.
Performance indicator: waiting times for emergency hospital care— proportion completed within 4 hours
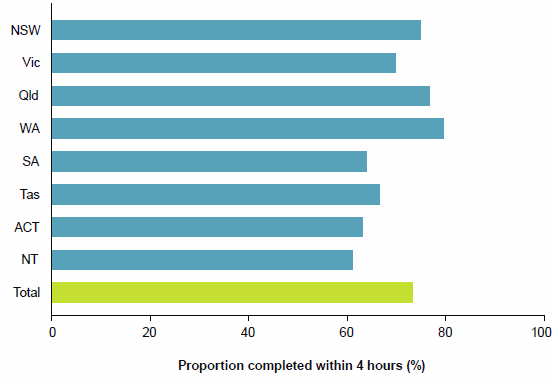
Between 2011–12 and 2014–15 the proportion of presentations completed (for example, the patient was discharged or admitted) within 4 hours increased from 64% to 73%.
In 2014–15:
- 73% of emergency department presentations were completed within 4 hours (Figure 10)
- the proportion completed within 4 hours varied among jurisdictions, ranging from 62% in the Northern Territory to 79% in Western Australia (Figure 10).
For more information, see Chapter 6 of Emergency department care 2014–15: Australian hospital statistics (AIHW 2015b).
Figure 10: Proportion of presentations completed within 4 hours, public hospital emergency departments, states and territories, 2014–15

Performance indicator: admission to hospital from emergency departments
For patients who are subsequently admitted, the length of stay indicates the amount of time spent in the emergency department before being moved to another ward in the hospital. This indicator is also known by the common name of 'Access block indicator'. It includes the percentage of presentations for patients who go on to be admitted where the length of stay is less than or equal to 4 hours, and the length of stay at the 90th percentile.
Proportion admitted within 4 hours
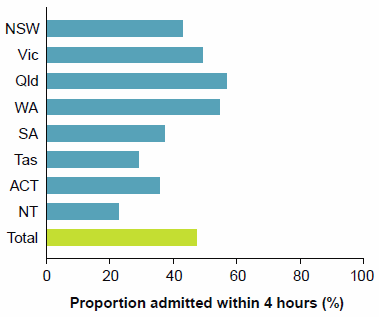
Between 2011–12 and 2014–15, the proportion of presentations completed within 4 hours increased from 30% to 47% for patients subsequently admitted to hospital.
In 2014–15, the proportion admitted within 4 hours varied among jurisdictions, ranging from 23% in the Northern Territory to 57% in Queensland (Figure 11).
Figure 11: Admission to hospital from emergency department—percentage of presentations where the length of stay is less than or equal to 4 hours, states and territories, 2014–15

90th percentile time to admission
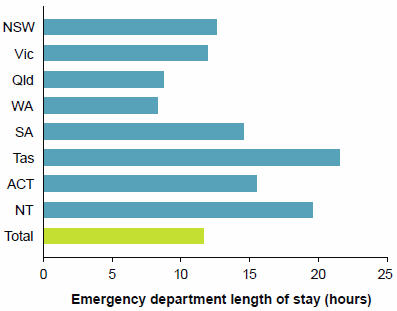
Between 2011–12 and 2014–15, the 90th percentile time to admission decreased from 14 hours and 23 minutes to 11 hours and 41 minutes.
In 2014–15, the 90th percentile time to admission varied among jurisdictions, ranging from 8 hours 19 minutes for Western Australia to 21 hours and 34 minutes for Tasmania (Figure 12).
For more information, see Chapter 6 of Emergency department care 2014–15: Australian hospital statistics (AIHW 2015b).
Figure 12: Admission to hospital from emergency department—emergency department length of stay at 90th percentile, states and territories, 2014–15

References
Australian Bureau of Statistics (ABS) 2016. Private hospitals, Australia 2014–15. ABS cat. no. 4390.0. Canberra: ABS.
Australian Institute of Health and Welfare (AIHW) 2015b Emergency department care 2014–15: Australian hospital statistics Health services series no. 65. Cat. no. HSE 168. Canberra: AIHW.


