Priority groups and wait list
Key findings
- Around three in four (73%) newly allocated dwellings in both public rental housing and community housing were provided to households in greatest need.
- Around three in five (59%) households were homeless prior to their public housing tenancy starting.
- Half (50%) of public housing households are single people, living alone.
- As at 30 June 2015, there were almost 200,000 households on social housing waiting lists (down from around 206,000 as at 30 June 2014).
- Social housing tenants assessed as having greatest need spent less time on waiting lists, with over a third (37%) of newly allocated public rental housing households and 50% of SOMIH households allocated housing in less than 3 months.
Historically, the focus of housing assistance has been to provide support to low-income working families. However, the provision of housing assistance has shifted over time to target a highly diverse range of vulnerable groups, such as people experiencing or who are imminently at risk of homelessness; households where there is a member with disability; households with a main tenant aged under 25 or aged 75 or over; or Indigenous households.
Greatest need
Social housing is allocated on a priority needs basis. Public rental housing, state owned and managed Indigenous housing (SOMIH) and mainstream community housing prioritise households by their 'greatest need'. Greatest need applies to low-income households if, at the time of allocation, household members were subject to one or more of the following circumstances:
- Homelessness
- Life or safety was threatened within existing accommodation
- Health condition was exacerbated by existing accommodation
- Existing accommodation was inappropriate to their needs
- They were experiencing very high rental costs.
A low-income household for the greatest need definition is a household that satisfies an eligibility test to receive housing assistance.
Source: Steering Committee for the Review of Government Service Provision, 2016.
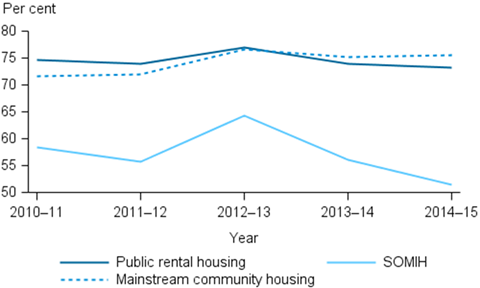
This is particularly evident for public rental housing with around three in four newly allocated dwellings provided to households in greatest need (73% in 2014–15) (Figure PG.1). For SOMIH, around half (52%) of newly allocated dwellings were provided to households in greatest need in 2014–15, down from a peak of 64% in 2012–13.
New community housing allocations to households in greatest need have increased over the past 5 years, from 72% in 2010–11, to 76% in 2014–15.
Figure PG.1: Proportion of newly assisted households in greatest need by housing program type, 2010–11 to 2014–15
Source: AIHW National Housing Assistance Data Repository, 2014–15. Source data.
Specialist Homelessness Services and social housing
Specialist Homelessness Services (SHS) play a key role in helping vulnerable people to obtain or maintain social housing (AIHW 2015a). Social housing provides the best solution to homelessness for many who approach SHS agencies. States and territories managed SHS agencies closely with social housing programs. SHS agencies provide support through the provision of services to prepare clients prior to entry into social housing, and often ongoing support to ensure that social housing tenancies are able to be maintained. Of the clients who presented to SHS agencies seeking assistance in 2014–15, 15% (24,336 clients) were living in public or community housing (AIHW 2015b). At the conclusion of SHS support, the proportion of clients living in public or community housing increased to 22% (35,279 clients).
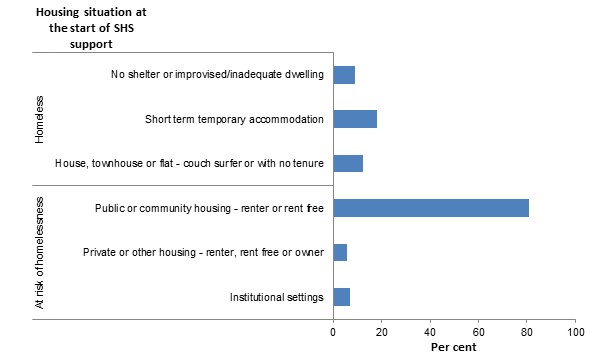
Figure PG.2 shows the first housing situation of SHS clients who ended support housed in public or community housing in 2014–15. Around four in ten (39%) SHS clients who ended SHS support in public or community housing were previously homeless with no shelter or living in improvised or inadequate dwellings (9%), living in unstable housing situations such as short term/temporary accommodation (18%) and couch surfing/living in a house with no tenure (12%) (For further information about housing situations please see the Glossary).
The vast majority (81%) of the SHS clients who ended their support in public or community housing were able to maintain their tenancy. This shows that the SHS support provided to clients currently in a public or community housing tenancy allowed them to maintain that tenancy and prevent a potential episode of homelessness. The main reason for public housing tenants to seek SHS assistance is generally due to financial difficulties (38%) (e.g. the tenant doesn't have the financial means to pay their rent, bills, food and/or other household essentials) (AIHW 2015a).
Figure PG.2: Specialist Homelessness Services clients housed in public or community housing at the end of support, by housing situation at first presentation, 2014–15, adjusted for non-response (per cent)
Source: AIHW Specialist Homelessness Services Collection.
Around three-in-five households (59%) were homeless
at the time of allocation to public rental housing and almost half (47%) at the time of allocation to SOMIH.
34% of households were at risk of homelessness
at the time of allocation to public rental housing and 44% at the time of allocation to SOMIH.
Special needs
Households that are in greatest need often have members with special needs. These include households with a member with disability, a main tenant younger than 25 or 75 and over, or households defined as Indigenous households (Steering Committee for the Review of Government Service Provision, 2016).
Because SOMIH is an Indigenous-targeted program, Indigenous households in SOMIH are not considered special needs households. For SOMIH households, only those that have a member with disability or a main tenant under 24 or over 50 are considered special needs.
Special needs and greatest needs categories are not mutually exclusive and tenants may fit into a number of categories within each group or across groups.
As at 30 June 2015, the proportion of new allocations among special needs groups differed across social housing programs:
- Of newly allocated public rental housing households with special needs, almost half (49%) contained at least one member with disability.
- Of newly allocated SOMIH households with special needs, 42% contained at least one member with disability, and 38% had a main tenant aged under 25 years.
Demographics of newly allocated households
Household composition
Compared to ongoing households, newly allocated households in both public housing and SOMIH were more likely to include dependent children and less likely to be comprised of single adults living alone.
As at 30 June 2015, half of newly allocated public rental housing households (50%) were made up of single people living alone, followed by sole parents with dependent children (31%). Public rental housing households were least likely to be couple only households or couple with dependent children households (both at 5%).
SOMIH households were also more likely to be made up of sole parents with dependent children (54%), followed by single adults (19%). SOMIH households were also least likely to be couple only households (3%).
Indigenous and disability status
Newly allocated households were also more likely to be Indigenous households as well as being more likely to include at least one member with a disability, than were ongoing households in both public housing and SOMIH.
For the year ending 30 June 2015, of newly allocated households to public rental housing, around 4,300 were Indigenous households (22% of all new allocations). There were just over 8,000 new allocations (48% of all allocations) to public rental housing for households with at least one member with disability.
Of new allocations to SOMIH, the proportion of all new allocations to households with at least one member with a disability was 42%. This proportion was lower for households where the main tenant was aged less than 25 years (24%).
Wait lists and wait times
Nationally, as at 30 June 2015, there were 154,000 applicants awaiting public rental housing allocation (down from 171,300 in 2010), and 7,600 applicants waiting for allocation to SOMIH programs (down from 10,000 in 2010). There were also around 37,500 applicants awaiting allocation to mainstream community housing as at 30 June 2015 (up from almost 36,700 in 2010). It is also important to note that applicants may be on more than one waitlist, and as such these numbers may be an overestimate of the total. Across these three types of social housing, around 69,000 of these applicants were categorised as being in greatest need.
Fluctuations in the numbers of those on wait lists are not necessarily measures of changes in underlying demand for social housing. A number of factors may influence the length of wait lists including changes to allocation policies and eligibility criteria put in place by state/territory housing authorities. Further, some people who wish to access social housing may also not apply due to the long waiting times or lack of available housing in their area.
Wait list priority is generally accorded to those with the greatest needs. In 2014–15, around 3 in 4 (74%) new allocations for public housing and just over half (52%) of new allocations for SOMIH went to those in greatest need categories.
As 'greatest need' eligibility criteria do not cover all needs for those in social housing, there are often limited choices for new entrants into the social housing system in regards to selection of dwelling type and locations. Tenant choices are often limited to broad geographic areas and/or types of dwellings. For example, public rental housing tenants often are given a limited number of offers at the time of allocation and if refused, they may risk their place on the waiting list.
Newly allocated households in greatest need are less likely than other households to spend an extended time on social housing waiting lists. In 2014–15, more than one-third (37%) of newly allocated public housing households and half (50%) of SOMIH households in greatest need spent less than 3 months on waiting lists. This compares to less than one-in-five (18%) public housing households and 31% of SOMIH households not in greatest need spending less than 3 months on social housing waiting lists (Figure PG.3).
For community housing, data on allocations by the amount of time spent on the waiting list are not currently available.
Figure PG.3: Proportion of new allocations, by time spent on the waiting list, by greatest and special needs households, by housing program type, 2014–15 (per cent)
Source: AIHW National Housing Assistance Data Repository 2014–15.
References
- Australian Institute of Health and Welfare (AIHW) 2015a. Exploring transitions between homelessness and public housing: 1 July 2011 to 30 June 2013. Cat. No. HOU 277. Canberra: AIHW.
- AIHW 2015b. Specialist Homelessness Services 2014–15.
- Steering Committee for the Review of Government Service Provision, 'Report on government services 2016'.