Priority groups and wait lists
Quick facts
- In 2017–18, there were 20,400 newly allocated households for public housing with a further 1,300 for state owned and managed Indigenous housing (SOMIH) and 15,800 for community housing.
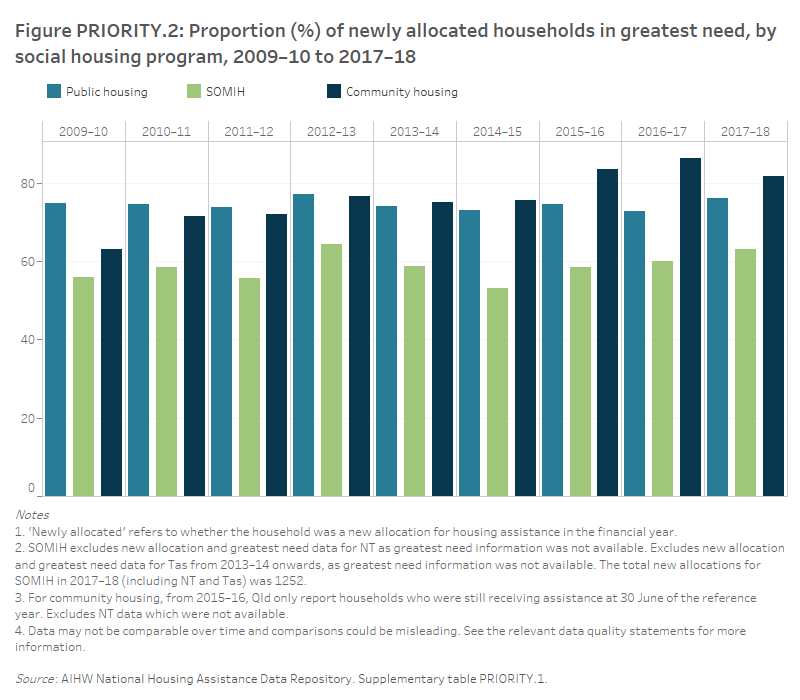
- The majority of new allocations in the 3 main social housing programs (public housing, SOMIH and community housing) were provided to those in greatest need (76% in public housing, 63% in SOMIH and 82% in community housing).
- Half (50%, or around 7,200 households) of the newly allocated greatest need households were experiencing homelessness prior to commencing their public housing tenancy in 2017–18. A further 39% were at risk of homelessness (see Assessing greatest need box below).
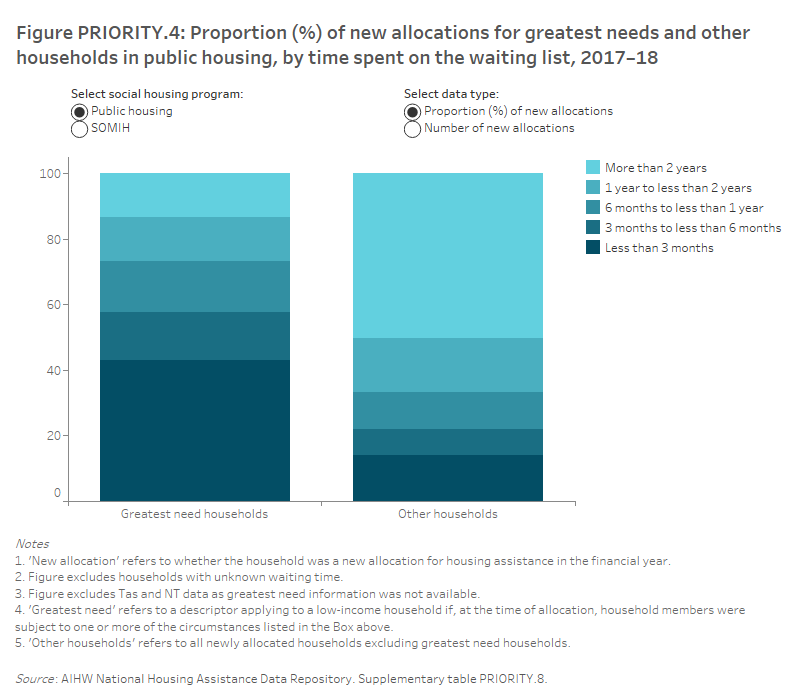
- Social housing households in greatest need spent less time on waiting lists than other households. Of the greatest need households, 2 in 5 (43%) newly allocated public housing households and 3 in 5 (62%) newly allocated SOMIH households were allocated housing in less than 3 months.
Historically, social housing has been targeted towards low-income families but, in recent years, the focus has shifted towards supporting a highly diverse range of vulnerable groups such as those experiencing trauma, disadvantage and/or financial instability (Groenhart & Burke 2014). As such, the focus of social housing has narrowed to tenants with greater disadvantage and higher and more complex needs than before.
Social housing is allocated according to priority needs, with allocations made on the basis of identifying those people with the greatest need and those with a special need for housing assistance.
Greatest need
An assessment of greatest need status is made of households applying for social housing (public housing, state owned and managed Indigenous housing (SOMIH) and community housing) and largely relates to experiences of homelessness.
Assessing greatest need
Greatest need applies to low-income households if, at the time of allocation, household members were subject to one or more of the following circumstances:
they were experiencing homelessness
- they were at risk of homelessness, including
- their life or safety was threatened within existing accommodation
- a health condition was exacerbated by existing accommodation
- their existing accommodation was inappropriate to their needs
- they were experiencing very high rental costs.
Public housing, SOMIH and community housing programs prioritise household allocations by assessing their greatest need status.
Source: SCRGSP 2019.
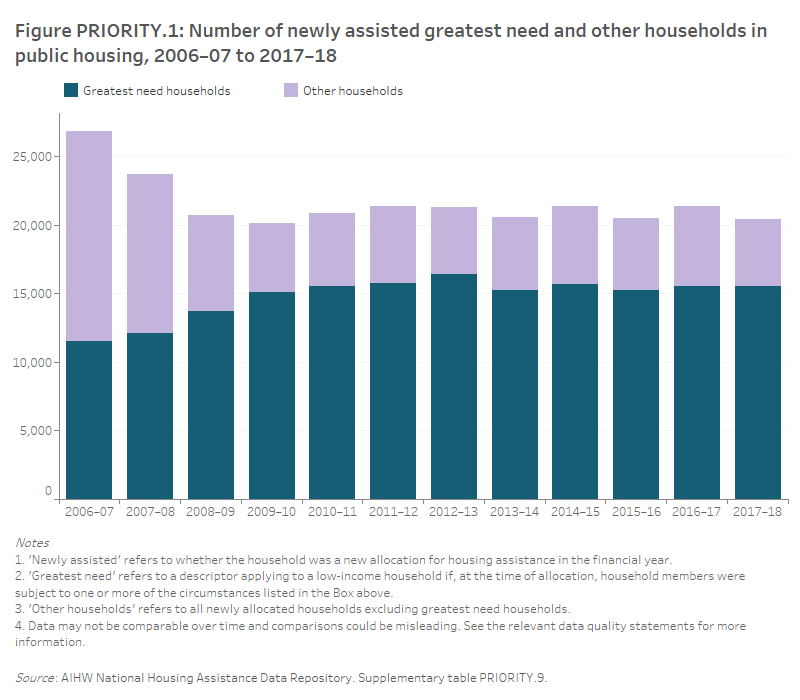
Housing Assistance in Australia reports on newly allocated households for housing assistance in each financial year, as well as the new allocations to households in greatest need. In 2017–18, there were 20,400 newly allocated households in public housing, 1,300 newly allocated SOMIH households and 15,800 newly allocated community housing households; representing 7% of total public housing households, 9% of total SOMIH households and 20% of total community housing households (Supplementary tables TENANTS.1, PRIORITY.1 and PRIORITY.4, respectively). The majority (76% or 15,600 households) of new public housing allocations were provided to households in greatest need. This proportion has fluctuated between 73–77% from 2009–10 to 2017–18 (Figures PRIORITY.1 and PRIORITY.2). In the 3 years prior, greatest needs households presented a smaller share of all new households.
This data visualisation displays the number of newly assisted greatest need and other households in public housing over time, from 2006–07 to 2017–18.

Community housing allocations to households in greatest need have also increased from 63% in 2009–10 to 82% in 2017–18. At this time, there were around 12,900 newly allocated greatest need households in community housing.
The following data visualisation displays the proportion of newly allocated greatest need households in public housing, SOMIH and community housing over time, from 2009–10 to 2017–18.

Main reason for greatest need
Many of the newly allocated households in social housing were assisted because they were either experiencing homelessness or at risk of homelessness (see above box on the definition of Assessing greatest need). Of the 20,400 newly allocated households in public housing:
- 35% were greatest need households experiencing homelessness at the time of allocation
- 27% were greatest need households at risk of homelessness
- 24% were not considered to be in greatest need (Supplementary tables PRIORITY.9 and PRIORITY.S5).
The main reasons for greatest need have varied over time. In 2017–18, of the 15,600 newly allocated public households in greatest need where the main reason was known (Table PRIORITY.1.1):
- half (50%, or 7,200 households) were households experiencing homelessness, down from a peak of 60% (or 9,100) in 2013–14
- 39% were to households at risk of homelessness (or 5,600 households); an increase from 34% in 2014–15
- of those at risk of homelessness, 3,100 reported the main reason for their greatest need was that their life or safety was at risk in their accommodation. Over 1,500 households reported a health condition aggravated by housing as their main reason (Supplementary tables PRIORITY.3 and PRIORITY.S5).
In 2017–18, the main reason for greatest need amongst new SOMIH households was similar, albeit comparatively small household numbers (around 400 new greatest need household allocations) with (Table PRIORITY.1.2):
- 43% of households (where the main reason was known) reporting homelessness as the main reason for greatest need, a decrease from a peak of 53% in 2015–16
- 40% at risk of homelessness, down from a peak of 47% in 2013–14 (Supplementary tables PRIORITY.3 and PRIORITY.S5).
Complete data on reasons for greatest need for community housing were not available due to data quality issues. Based on the available data in 2017–18, of the new households in community housing in greatest need where the main reason was known (Table PRIORITY.1.3):
- almost 4,700 (43%) households were experiencing homelessness, an increase from 3,100 in 2013–14
- around 6,100 (57%) households were at risk of homelessness, an increase from 2013–14 (53%, or 3,400 households) (Supplementary tables PRIORITY.3 and PRIORITY.S5).
|
Year |
Homeless |
Total at risk of homelessness |
Other |
Not stated(c) |
Total new greatest need households |
|---|---|---|---|---|---|
|
2011–12 |
8,602 |
5,680 |
1,154 |
350 |
15,786 |
|
2012–13 |
9,130 |
5,632 |
1,310 |
339 |
16,411 |
|
2013–14 |
9,058 |
5,248 |
600 |
283 |
15,256 |
|
2014–15 |
8,950 |
5,185 |
1,114 |
421 |
15,670 |
|
2015–16 |
8,122 |
4,827 |
661 |
1,662 |
15,272 |
|
2016–17 |
7,836 |
5,675 |
1,240 |
818 |
15,569 |
|
2017–18 |
7,181 |
5,554 |
1,556 |
1,279 |
15,570 |
|
Year |
Homeless |
Total at risk of homelessness |
Other |
Not stated(c) |
Total new greatest need households |
|---|---|---|---|---|---|
|
2011–12 |
219 |
143 |
69 |
— |
431 |
|
2012–13 |
262 |
216 |
73 |
1 |
552 |
|
2013–14 |
209 |
201 |
17 |
9 |
436 |
|
2014–15 |
204 |
192 |
43 |
— |
439 |
|
2015–16 |
235 |
173 |
37 |
4 |
449 |
|
2016–17 |
179 |
187 |
52 |
1 |
419 |
|
2017–18 |
170 |
158 |
69 |
— |
397 |
|
Year |
Homeless |
Total at risk of homelessness |
Other |
Not stated(c) |
Total new greatest need households |
|---|---|---|---|---|---|
|
2011–12 |
n.a. |
n.a. |
n.a. |
n.a. |
9,742 |
|
2012–13 |
n.a. |
n.a. |
n.a. |
n.a. |
8,482 |
|
2013–14 |
3,056 |
3,435 |
n.a. |
2,816 |
9,307 |
|
2014–15 |
3,361 |
4,158 |
n.a. |
3,228 |
10,747 |
|
2015–16 |
4,264 |
4,359 |
n.a. |
2,472 |
11,095 |
|
2016–17 |
4,189 |
5,025 |
n.a. |
1,681 |
10,895 |
|
2017–18 |
4,662 |
6,094 |
n.a. |
2,154 |
12,910 |
n.a. Not available
(a) Whether the household was a new allocation for housing assistance in the financial year.
(b) A descriptor applying to a low-income household if, at the time of allocation, household members were subject to one or more circumstances (refer to description above for more information).
(c) Where the greatest need reason is unknown or not provided.
(d) Excludes Tas and NT data as greatest need information was not available.
(e) Includes greatest need households where the homeless indicator was known. Greatest need reason (apart from homeless) is not available for community housing. From 2015–16, Qld only reports households who were still receiving assistance at 30 June of the financial year. Excludes NT data which were not available.
Note: Only the main greatest need reason is reported.
Source: AIHW National Housing Assistance Data Repository. Supplementary table PRIORITY.S5.
Special needs
Households seeking assistance from social housing providers often have members with special needs. Some households may have multiple special needs. The definition of special needs is different for different social housing programs.
Assessing special need
For public housing, special needs households include those with:
- a member with disability,
- a main tenant younger than 25 years or older than 75, or
- one or more members who identify as Aboriginal and/or Torres Strait Islander.
As SOMIH is an Indigenous targeted program, Indigenous households in SOMIH are not considered special needs households. For SOMIH, special needs households are only those that have:
- a member with disability or
- a main tenant under 25 years or over 50.
Source: SCRGSP 2019.
In 2017–18, there were 12,400 new public housing households with special needs. Of these:
- over half (52%, or 6,500 households) had at least one member with disability
- 2 in 5 (42%, or 5,200 households) had at least one Indigenous member
- 1 in 5 (22%, or 2,700 households) had a main tenant aged under 25 (Supplementary table PRIORITY.5).
In 2017–18, of the 500 newly allocated SOMIH households with special needs:
- over half (54%, or 300 households) contained a main tenant aged 50 and over
- 3 in 10 (30%, or 170 households) had a main tenant aged under 25 years
- almost one-quarter (23%, or 130 households) contained at least one member with disability (Supplementary table PRIORITY.5).
SOMIH includes data for the Northern Territory for the first time in 2017–18.
Greatest and special needs
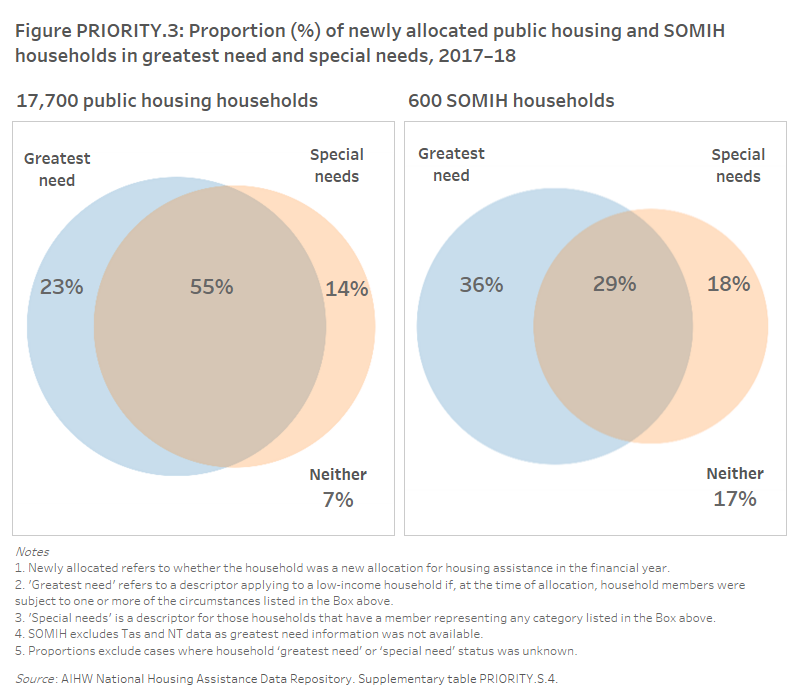
Greatest needs and special needs categories are not mutually exclusive and tenants may fit into a number of categories within each group or across groups (Figure PRIORITY.3). Households with members that have both greatest and special needs may be some of the most vulnerable households and may require high levels of care and support.
In 2017–18, where the need was stated:
- over half (55%, or 9,800) of newly allocated households in public housing were both greatest and special needs households
- 3 in 10 (29%, or almost 200) newly allocated households in SOMIH were both greatest and special needs households (Supplementary table PRIORITY.S4).
The following diagram displays for public housing and SOMIH, the proportion of newly allocated households that were greatest need, special needs, both greatest and special needs or neither.

Wait lists
Access to social housing is managed using waiting lists, with shorter waiting times expected for priority applicants. Nationally, at 30 June 2018, there were:
- 140,600 applicants on a wait list for public housing (down from 154,600 at 30 June 2014)
- 8,800 applicants on a wait list for SOMIH dwellings (up from 8,000 at 30 June 2014) (Supplementary table PRIORITY.7).
Of those new applicants on the wait list at 30 June 2018:
- 45,800 applicants on the waiting list for public housing were in greatest need. This is an increase of over 2,600 people in greatest need on the public housing waiting list since 30 June 2014.
- almost 4,700 applicants were in greatest need and waiting for SOMIH dwellings, up from 3,800 at 30 June 2014 (Supplementary table PRIORITY.7).
Data for both community housing and Indigenous community housing were unavailable.
Fluctuations in the numbers of those on wait lists are not necessarily measures of changes in underlying demand for social housing. A number of factors may influence the length of wait lists including changes to allocation policies, priorities and eligibility criteria put in place by state/territory housing authorities. Further, some people who wish to access social housing may not apply due to the long waiting times or lack of available options in their preferred location. It is also important to note that in some states/territories applicants may be on more than one wait list and, as such, combined figures are expected to be an overestimate of the total. For further details, see Data quality statement.
Wait times
In this analysis, total waiting list times for those in greatest need were calculated from the date of greatest need determination to the housing allocation date. For other households not in greatest need, the waiting list time is from housing application to housing allocation.
In 2017–18, among new allocations to greatest needs households, the majority (73%, or 11,400) received public housing within one year of the household being on the waiting list (Figure PRIORITY.4). By contrast, far fewer (33%, or 1,600) other households who were not in greatest need, were allocated housing within a year on the waiting list. Half (50%) of newly allocated households not in greatest need, spent more than two years on the waiting list before public housing allocation.
Similarly for SOMIH, newly allocated households in greatest need were less likely than other households to spend an extended period of time on waiting lists. In 2017–18, 89% of newly allocated SOMIH households in greatest need spent less than 12 months on waiting lists (Figure PRIORITY.4). This includes 62% who spent less than 3 months. In comparison, 71% of newly allocated households not in greatest need were on the SOMIH waiting list for less than 12 months, including 51% spending less than 3 months (Supplementary table PRIORITY.8).
For community housing, data on allocations by the amount of time spent on the waiting list were not available.
The following interactive data visualisation displays the proportion and number of newly allocated households in greatest need or other, for public housing and SOMIH, by time spent on the waiting list, for 2017–18.

For the new special needs households, the waiting time represents the period from the housing application to the housing allocation. The time spent on the waiting list for new special needs households in public housing varied, with around:
- 3,600 households waiting for less than 3 months
- 5,400 households waiting between 3 months and 2 years
- 3,400 households waiting more than 2 years (Supplementary table PRIORITY.4).
Specialist Homelessness Services
Specialist Homelessness Services (SHS) play a key role in helping vulnerable people obtain or maintain social housing (AIHW 2018). Social housing can provide a solution to homelessness for many who approach SHS agencies. SHS agencies offer support through the delivery of services to prepare clients prior to commencing social housing tenancies, and also provide ongoing support to ensure tenancies are maintained. Information about the transition of people who are homeless or at risk of homelessness into social housing programs is provided in Specialist homelessness services annual report 2017–18.
References
- Groenhart L & Burke T 2014. Thirty years of public housing supply and consumption: 1981–2011, AHURI Final Report No.231. Melbourne: Australian Housing and Urban Research Institute. Viewed 7 January 2019.
- SCRGSP (Steering Committee for the Review of Government Service Provision) 2019. Report on Government Services 2019. Canberra: Productivity Commission.
- AIHW (Australian Institute of Health and Welfare) 2018. Specialist Homelessness Services 2017–18. Cat. no. HOU 299. Canberra: AIHW.


