Social housing tenants
Quick facts
- In 2017–18, there were around 803,900 tenants in Australia’s 3 main social housing programs (public housing, state owned and managed Indigenous housing (SOMIH) and community housing). The majority (75%) of tenants were in public housing.
- There were around 398,900 households in the main social housing programs in 2017–18, increasing from 378,600 in 2007–08 (at June 30 in the reference year).
- The number of households in community housing has more than doubled (up 130%) from around 35,000 in 2007–08 to 80,600 in 2017–18.
- Across the main social housing programs, a greater proportion of main tenants were female (62%), while over half of households were comprised of single adults (55%).
- Public housing had an older age profile than other social housing programs, with over one-third (35%) of all tenants aged 55 and over; less for community housing (30%).
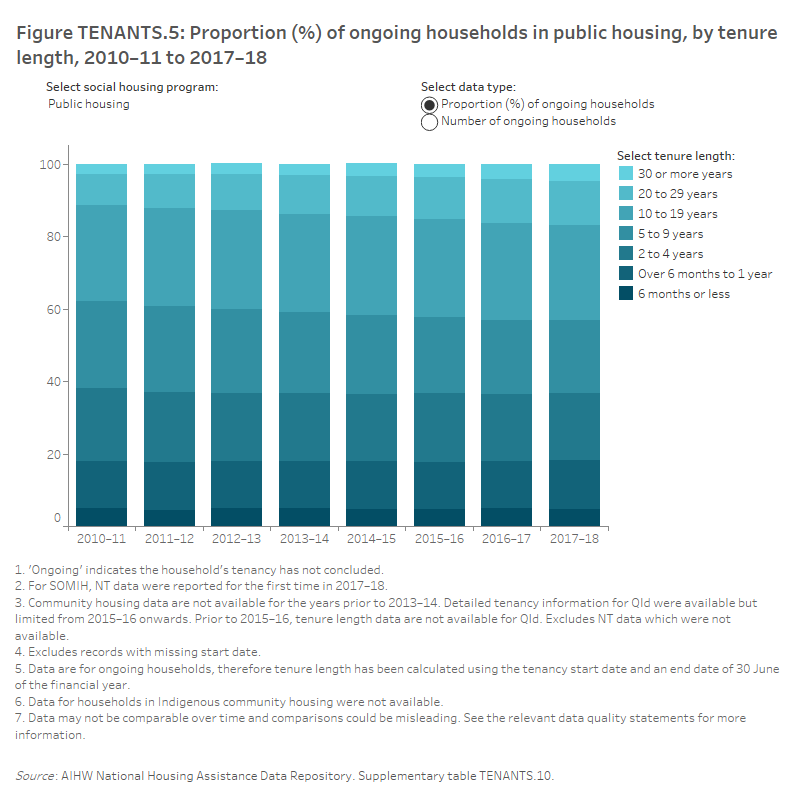
- Four in 10 (43%) households in public housing had been in their tenancies for 10 years or more.
Social housing
Social housing includes rental housing owned and managed by government or non-government organisations (including not-for-profit organisations) which can be rented to eligible households. Social housing rents are generally set below market levels and are influenced by the income of the household.
Data included here on social housing includes three programs; public housing, state owned and managed Indigenous housing (SOMIH) and community housing. Indigenous community housing is out of scope for this section due to incomplete data for some states and territories.
Information is presented about households (that is, a group of 2 or more related or unrelated people residing in the same dwelling) as well as tenants in social housing. For the purposes of this analysis, ongoing households are those with a tenancy that has not concluded. The information for households is at 30 June in the reference year while for tenants, it is during a one year period.
In 2016–17, some information was reported about 5,000 dwellings who transferred from public housing to SOMIH. For the first time in 2017–18, households and tenants information is reported for these dwellings.
Tenants in social housing
In 2017–18, there were around 803,900 tenants in Australia’s 3 main social housing programs: public housing, state owned and managed Indigenous housing (SOMIH) and community housing (complete data were not available for all programs in Queensland and the Northern Territory). The majority of these tenants remained in social housing throughout the year while some transferred between programs and others exited.
Of the social housing tenants in 2017–18:
- 75% were in public housing (around 600,600 tenants)
- 19% were in community housing (around 153,200 tenants)
- 6% were in SOMIH (around 50,100 tenants) (Supplementary table TENANTS.5).
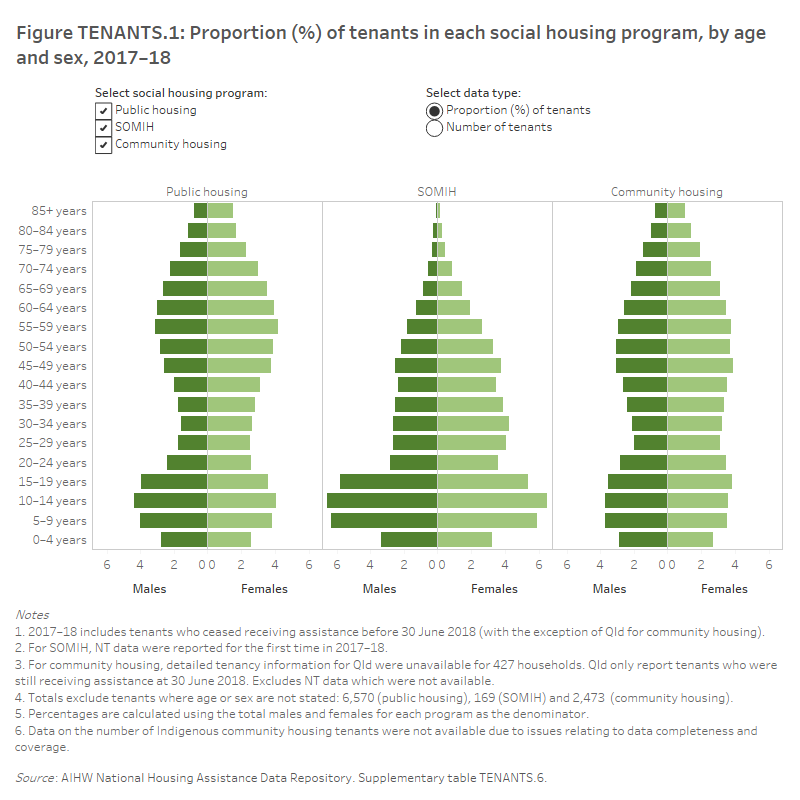
Females made up the majority of all tenants across the three main social housing programs, including 331,300 (56%) in public housing, 27,600 (55%) in SOMIH and 83,600 (55%) in community housing (Supplementary table TENANTS.6).
In 2017–18, around one-third of all social housing tenants were older persons aged 55 years and over (35% for public housing, 30% for community housing). A large proportion were also children aged under 15 years. Almost one-third (32%) of SOMIH tenants, 22% of public housing tenants and 20% of community housing tenants were children aged 0–14 years (Figure TENANTS.1).
The following interactive data visualisation displays the age and sex profile of the three main social housing programs for 2017–18.
Figure TENANTS.1: Proportion (%) of tenants in each social housing program, by age and sex, 2017–18
Households in social housing
At 30 June 2018, there were around 398,900 households living in the 3 main social housing programs across Australia, up from 378,600 in 2007–08. In these main social housing programs:
- 304,500 households (76%) were in public housing
- 80,600 households (20%) were in community housing
- 13,800 households (3%), were in SOMIH (Supplementary table TENANTS.1).
The number of public housing households has decreased from 331,100 in 2007–08 to around 304,500 in 2017–18, offset by an increase in community housing households (from 35,000 to 80,600 over the same period). The number of SOMIH households declined from 12,400 in 2007–08 to 9,600 households in 2016–17. In 2017–18, when SOMIH household data for the Northern Territory were reported for the first time, the number of SOMIH households increased to 13,800 (Supplementary table TENANTS.1; Figure TENANTS.2).
The following data visualisation displays the number of households in the 3 main social housing programs for each year from 2007–08 to 2017–18.
Figure TENANTS.2: Number of social housing households, by social housing program, 2007-08 to 2017-18
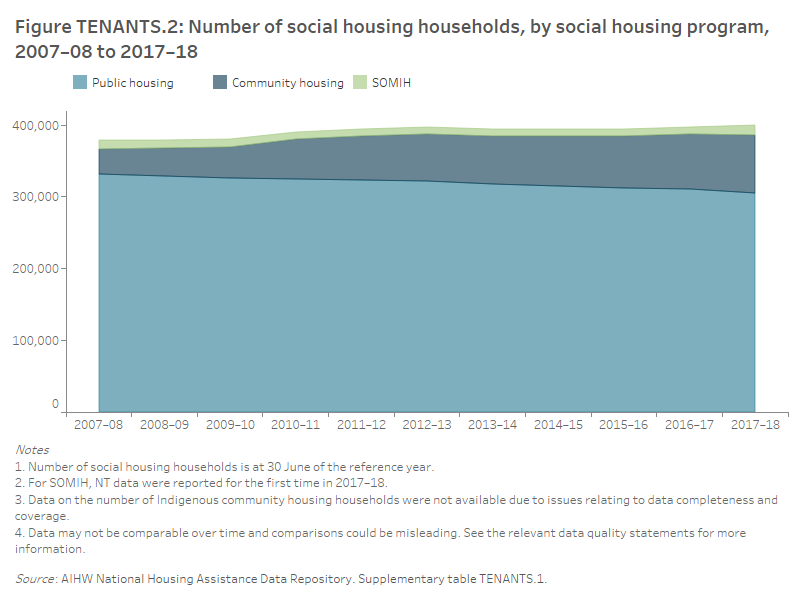
These changes reflect a gradual but steady shift in the policy focus towards growing the community housing sector and transferring ownership and/or management of public housing stock to community housing organisations.
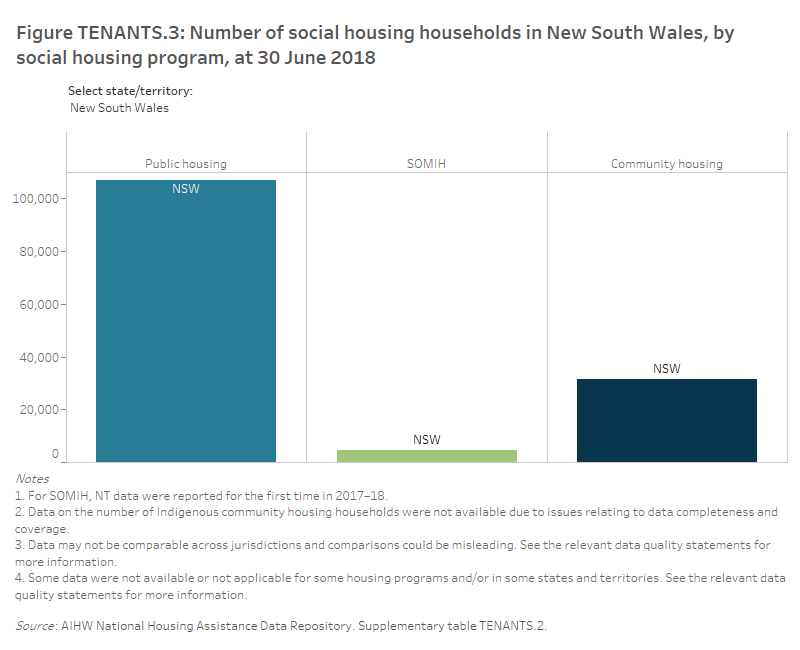
At 30 June 2018, over one-third (35%, or 106,900) of public housing households were located in New South Wales, followed by Victoria (20%, or 62,200) and Queensland (16%, or 50,200). New South Wales was also home to the most households in community housing (31,400, or 39%) while the most SOMIH households were in the Northern Territory (4,600, or 33%) and New South Wales (4,400, or 32%) (Figure TENANTS.3).
The following interactive data visualisation displays the number of households in the 3 main social housing programs by state/territory, for 2017–18.
Figure TENANTS.3: Number of social housing households in New South Wales, by social housing program, at 30 June 2018
Across remoteness areas, most (71%) social housing households were located in Major cities, followed by 17% in Inner regional areas, 9% in Outer regional areas, 2% in Remote areas and 2% in Very remote areas (Supplementary table TENANTS.3). The majority of public housing households (74%) and community housing households (68%) were in Major cities, while the highest proportion of SOMIH households were in Remote and Very remote areas (40% combined). The location of SOMIH households is different to previously collection periods, reflecting the reporting of information about SOMIH households in the Northern Territory for the first time in 2017–18.
Profile of social housing tenants
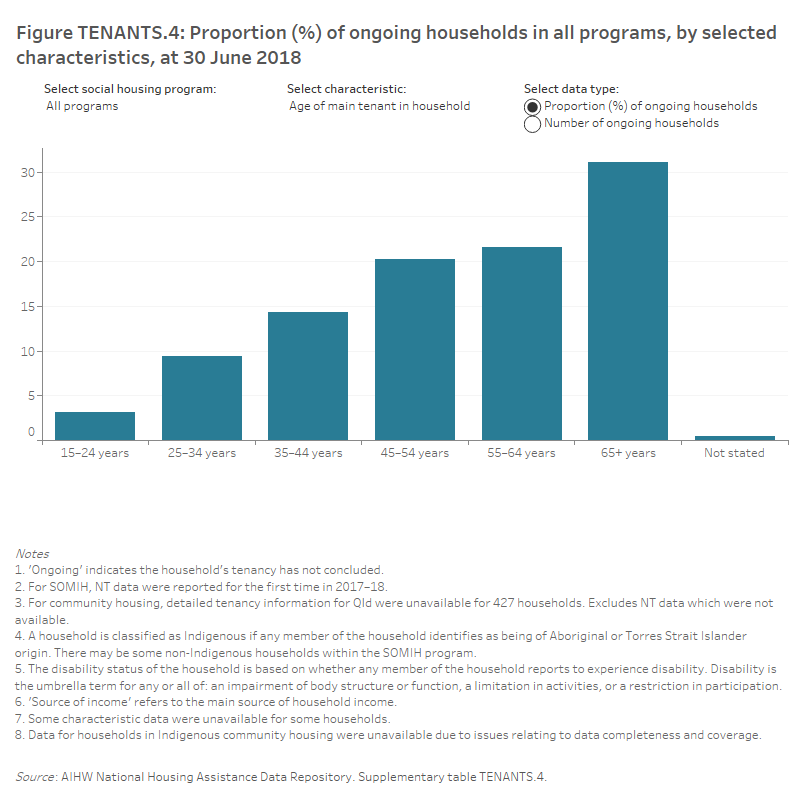
While there were variations in the profile of tenants in the different social housing programs, key characteristics among social housing households as at 30 June 2018 were:
- almost two-thirds (62%) of main tenants were female
- main tenants aged 65 years or older were the largest age group (31%, or 123,600 households)
- over 1 in 10 (13%, or 53,700) included an Indigenous member
- almost 2 in 5 (38%, or 151,500) included a tenant with disability
- most households comprised single adults (55%, or 220,700) (Figure TENANTS.4).
The following interactive data visualisation displays the number and proportion of ongoing households in the 3 main social housing programs by selected characteristics such as sex, Indigenous household, household composition and income source, for 2017–18.
Figure TENANTS.4: Proportion (%) of ongoing households in all programs, by selected characteristics, at 30 June 2018
Tenant satisfaction
Results from the 2018 National Social Housing Survey (NSHS) show that tenant satisfaction with services from their housing provider is closely associated with the condition of their home, with satisfaction falling significantly as the number of structural problems increase (AIHW 2019). This relationship holds after accounting for a wide range of geographic, demographic and housing-related factors. There were also significant relationships between tenant satisfaction and the number of working facilities in the home, time spent living in social housing, household composition, housing program and geographic variables such as state or territory.
The 2018 NSHS results also showed that 3 in 4 (75%) social housing tenants Australia-wide were satisfied with the services provided by their housing organisation. This high overall level of satisfaction has not changed significantly since 2014 (73%). Public and community housing tenants’ satisfaction has remained stable since 2014, while the satisfaction of SOMIH tenants has increased. Community housing tenants (80%) were more satisfied than public housing tenants (73%) or SOMIH tenants (68%) with the services offered by their housing providers in 2018.
Further information about tenant satisfaction with amenities, locations and services as well as the economic, health and social benefits of social housing, is published in the National Social Housing Survey 2018 (AIHW 2019).
Length of tenure
A substantial proportion of households in public housing and SOMIH remain in tenure for long periods of time. At 30 June 2018, 43% of public housing and 25% of SOMIH ongoing households had been in the same tenure for more than a decade. Around 1 in 5 tenancies for these ongoing households had been in place for less than a year (18% for public housing and 22% for SOMIH). By contrast, 14% of community housing ongoing households had been in the same tenure for more than a decade and one-third (33%) had been in place for less than a year. This may be related to the length of time community housing dwellings have been available (Figure TENANTS.5).
Over time, the proportion of ongoing households with long-term tenure has increased. For public housing, there has been an increase in the proportion of households with a tenure length of 20–29 years, rising from 9% in 2010–11 to 12% in 2017–18; similarly for a tenure length of 30 years or more there has been an increase from 3% to 5% over the same period.
The following interactive data visualisation displays the different lengths of tenure of ongoing households in the 3 main social housing programs over time, from 2010–11 to 2017–18.
Figure TENANTS.5: Proportion (%) of ongoing households in public housing, by tenure length, 2010–11 to 2017–18
Entries, exits and transfers
Households entering social housing
The number of new allocations has remained relatively stable for public housing over the last 7 years (Table TENANTS.1). In 2017–18, 20,400 households were newly allocated to public housing.
There have been some fluctuations in the numbers of newly allocated households in SOMIH since 2011–12, with a decrease from 700 in 2016–17 to 600 in 2017–18.
Data were not available for the community housing programs.
Households exiting social housing
Between 2011–12 and 2017–18, the number of households that exited public housing programs has varied (Tables TENANTS.1.1 and TENANTS.1.2). From year to year, the change in the number of households that have exited has ranged from a 6% increase (from 2012–13 to 2013–14) to a 6% decrease (from 2013–14 to 2014–15). Most recently, there has been a 14% increase in the number of households that exited, from 23,100 in 2016–17 to 26,400 in 2017–18.
In recent years there have been more households that exited public housing compared with newly allocated households in public housing. In 2017–18, 26,400 households exited while 20,400 households were newly allocated to public housing. This may be due to stock transfers from public housing to community housing.
For SOMIH households, there is considerable variability in the number of exits from year to year. This is partly due to housing stock transfers. In recent years, there has been a greater number of households ending their tenancy in SOMIH programs (as measured by the number of exits) when compared with the number of newly allocated SOMIH households. During 2017–18 for example, while there were over 600 newly allocated SOMIH households, around 1,000 households ended their SOMIH tenancies. This includes a number of SOMIH dwellings in South Australia that were transferred to community housing (Supplementary table TENANTS.9 and TENANTS.11).
Data for community housing were not available for this analysis.
|
Year |
Ongoing households(a) |
Newly allocated households(b) |
Households that exited(c) |
Percentage change from previous year of households that exited (%)(c) |
|---|---|---|---|---|
|
2011–12 |
323,423 |
21,365 |
22,850 |
. . |
|
2012–13 |
321,213 |
21,299 |
23,509 |
2.9 |
|
2013–14 |
317,008 |
20,611 |
24,816 |
5.6 |
|
2014–15 |
314,963 |
21,410 |
23,455 |
-5.5 |
|
2015–16 |
312,219 |
20,502 |
23,246 |
-0.9 |
|
2016–17 |
310,483 |
21,387 |
23,123 |
-0.5 |
|
2017–18 |
304,532 |
20,418 |
26,369 |
14.0 |
|
Year |
Ongoing households(a) |
Newly allocated households(b) |
Households that exited(c) |
Percentage change from previous year of households that exited (%)(c) |
|---|---|---|---|---|
|
2011–12 |
9,692 |
774 |
646 |
. . |
|
2012–13 |
9,820 |
858 |
730 |
13.0 |
|
2013–14 |
9,790 |
777 |
807 |
10.5 |
|
2014–15 |
9,732 |
852 |
910 |
12.8 |
|
2015–16 |
9,660 |
797 |
869 |
-4.5 |
|
2016–17 |
9,574 |
719 |
805 |
-7.4 |
|
2017–18 |
9,200 |
646 |
1,020 |
26.7 |
. . Not applicable
(a) Ongoing indicates the household’s tenancy has not concluded.
(b) Whether the household was a new allocation for housing assistance in the financial year.
(c) Includes households living in housing stock that was transferred from public housing or SOMIH to community housing in the reference period. In 2017–18, in SA in particular, a large number of dwellings were transferred from public housing or SOMIH to community housing.
(d) Excludes NT data which were not available. The total new allocations for SOMIH in 2017–18 (including NT) was 1252.
Notes
- Data on transferred and exited households were only available for the public housing and SOMIH programs.
- Data may not be comparable across jurisdictions and comparisons could be misleading. See the relevant data quality statements for more information.
Source: AIHW National Housing Assistance Data Repository. Supplementary table TENANTS.9.
Household transfers
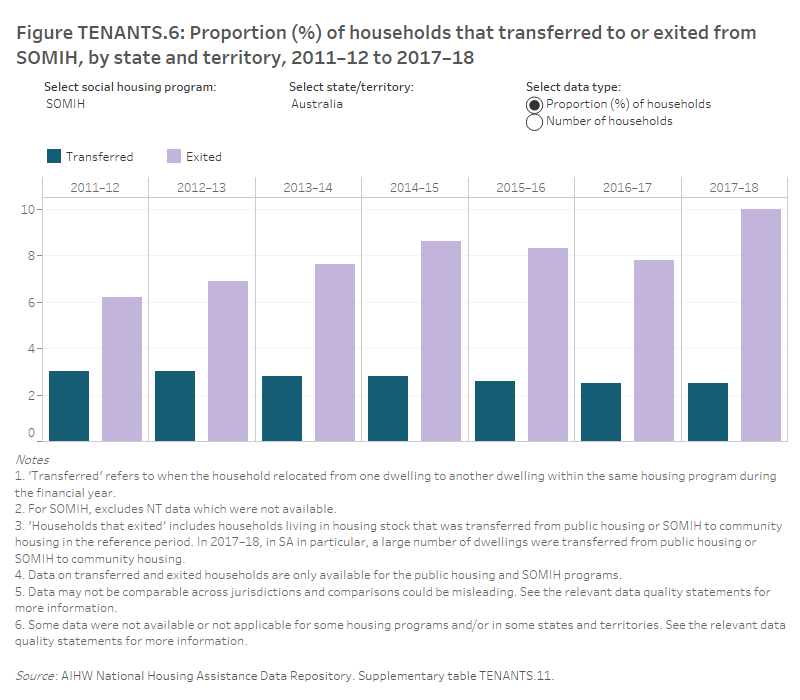
During 2017–18, 3% of public housing households and 3% of SOMIH households transferred to a different dwelling (Supplementary table TENANTS.11). This may have been due to state and territory housing authorities seeking to match tenant characteristics to household size. For example, by moving a single tenant household into a smaller dwelling to make room for a larger family household on the waitlist, or tenants requesting relocation to a different geographic area.
The rate of households leaving social housing (as measured by exit rates) was higher than transfer rates as for 2017–2018, with 8% (26,400) of public housing households and 10% (1,000) of SOMIH households exiting during the year (Figure TENANTS.6).
The following interactive data visualisation displays the number and proportion of households that transferred to, or exited from the 3 main social housing programs over time, from 2011–12 to 2017–18.
Figure TENANTS.6: Proportion (%) of households that transferred to or exited from SOMIH, by state and territory, 2011–12 to 2017–18
Glossary
References
- Pawson H, Martin C, Flanagan K & Phillips R 2016. Recent housing transfer experience in Australia: implications for affordable housing industry development, AHURI Final Report No. 273. Melbourne: AHURI. doi:10.18408/ahuri-7108101.
- AIHW (Australian Institute of Health and Welfare) 2019. National Social Housing Survey 2018. Cat. no. HOU 311. Canberra: AIHW.


