Prevalence of trichiasis
Measure 1.3.2: The estimated number, and proportion of Indigenous adults in at-risk communities with trichiasis
Repeated trachoma infections can result in scarring and in-turned eye lashes, trichiasis. Early detection and treatment of trichiasis can prevent blindness.
Figure 1.3.2: Prevalence of trichiasis
Figures for measure 1.3.2 presents 3 separate charts showing the prevalence of trichiasis in at-risk Indigenous communities, for Indigenous Australians by various characteristics.
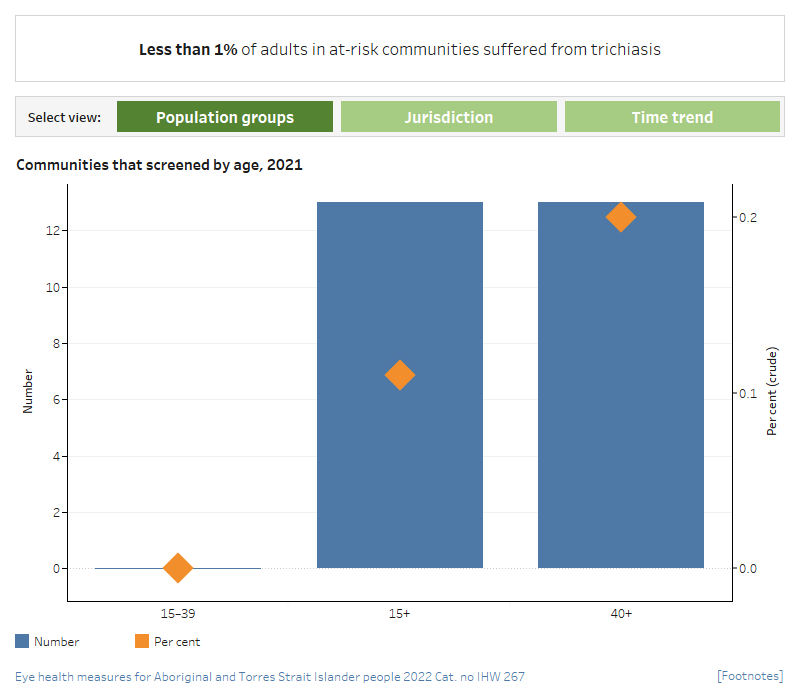
Prevalence of trichiasis in communities that screened by age, 2021
This dual axis combined vertical bar chart and scatter plot compares the percentage and number of Indigenous Australians with trichiasis in at-risk Indigenous communities, in two broad age groups, and for all Australians aged 15 and over in 2021. The chart shows that there were 13 Indigenous Australians aged 40 and over with trichiasis, a prevalence rate of 0.2%. There were no Australians aged 15–39 with trichiasis in these communities.
Prevalence of trichiasis in communities that screened among those aged 40 and over, 2011 to 2021
This dual axis combined line graph and scatter plot shows the percentage and number of Indigenous adults aged 40 and over with trichiasis, from 2011 to 2021. The chart shows that, from 2011 to 2021, the percentage of Indigenous Australians aged 40 and over with trichiasis fell from 1.6% to 0.2%.
Prevalence of trichiasis in communities that screened among those aged 40 and over, by jurisdiction, 2021
This dual axis combined vertical bar chart and scatter plot compares the number and percentage of Indigenous adults aged 40 and over with trichiasis, for 3 jurisdictions in 2021. The chart shows that the prevalence of trichiasis in Indigenous Australians aged over 40 was highest in Western Australia and South Australia (both 0.2%). Queensland had no cases of trichiasis.

- The proportion of Indigenous Australians aged 40 and over with trichiasis fell from 1.6% in 2011 to 0.2% in 2021.
- Among the 4 jurisdictions that undertook screening in 2021, the prevalence of trichiasis in Indigenous Australians was 0.21% in the Northern Territory, 0.20% in South Australia and 0.15% in Western Australia. In Queensland, no adults aged 40 and over who were screened were found to have trichiasis.


