Hospitalisations for diseases of the eye
Measure 3.1: The number of hospitalisations for diseases of the eye, per 1,000 Indigenous Australians.
Hospitalisations reflect both the occurrence in the population of eye conditions which are serious enough to require hospitalisation, as well as access to and use of hospitals services.
Figure 3.1: Hospitalisations for diseases of the eye
There are 8 separate charts for this measure showing hospitalisation rates for diseases of the eye, for Indigenous and non-Indigenous Australians, by various characteristics.
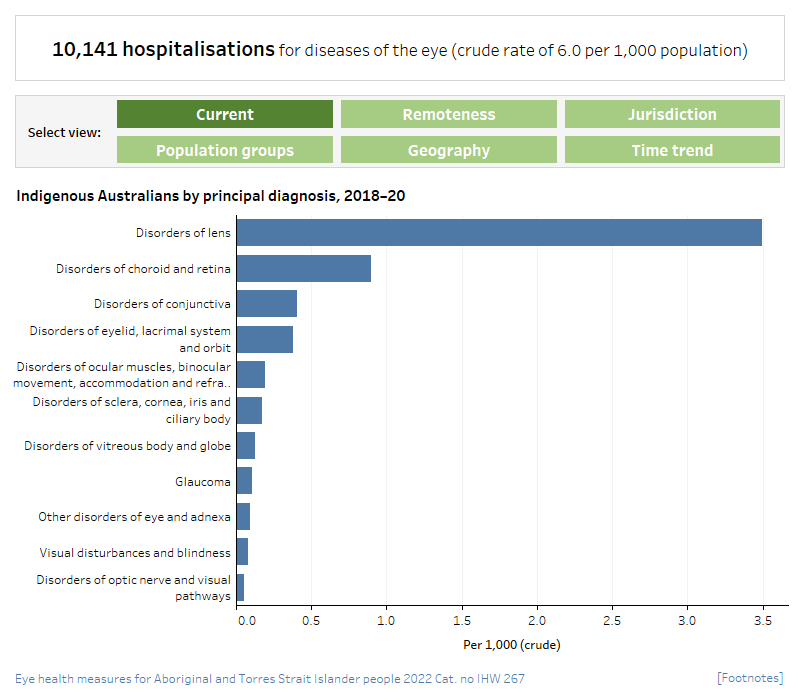
Hospitalisations for Indigenous Australians for diseases of the eye, by principal diagnosis, 2018–20
This horizontal bar chart compares the hospitalisation rate for Indigenous Australians for diseases of the eye, in 2018–20, by principal diagnosis. The chart shows that the most common principal diagnosis for hospitalisations for diseases of the eye was disorders of the lens (3.5 per 1,000). The rate of hospitalisations for disorders of the choroid & retina was 0.9 per 1,000. Disorders of conjunctiva and disorders of eyelid, lacrimal system & orbit were both 0.4 per 1,000.
Hospitalisations for diseases of the eye, by Indigenous status and region, 2018–20
This vertical bar chart compares age standardised rates of hospitalisation for diseases of the eye in 2018–20, by Indigenous status and remoteness category of geographic location. The chart shows that hospitalisation rates were highest for Indigenous Australians in Remote and very remote areas (combined) (13 per 1,000) and lowest in Major cities (10.2 per 1,000).
Hospitalisations for diseases of the eye, by Indigenous status and jurisdiction, 2018–20
This vertical bar chart compares age standardised rates of hospitalisation for diseases of the eye in 2018–20, by Indigenous status and by state and territory. The chart shows that hospitalisation rates for Indigenous Australians for diseases of the eye were lowest in the Australian Capital Territory (4.5 per 1,000) and Tasmania (6.4 per 1,000) and were highest in Queensland and Western Australia (both around 13 per 1,000) followed by the Northern Territory (12 per 1,000).
Hospitalisations for Indigenous Australians for diseases of the eye, by age and sex 2018–20
This vertical bar chart compares hospitalisation rates for diseases of the eye in 2018–20, by age and sex. The chart shows that hospitalisation rates rose with age for males and females. Hospitalisation rates were similar for males and females for all age groups up to 75 and over. For those aged 75 and over, rates were higher for Indigenous males (80 per 1,000) than Indigenous females (68 per 1,000).
Hospitalisations for Indigenous Australians for diseases of the eye, by PHN, 2018–20 (bar chart)
This horizontal bar chart compares the hospitalisation rate for diseases of the eye for Indigenous Australians in 2018–20, by PHN, grouped by state. The chart shows that the PHNs with the lowest hospitalisation rates for Indigenous Australians for diseases of the eye were the Australian Capital Territory and Western Sydney (NSW) (both 1.9 per 1,000). The PHNs with the highest hospitalisation rates for Indigenous Australians were Western Queensland (Qld) and Country WA (WA) (9.1 and 8.5 per 1,000, respectively).
Hospitalisations for diseases of the eye, Indigenous persons by age, 2012–13 to 2019–20
This line graph shows Indigenous hospitalisation rates for diseases of the eye, in 2012–13 to 2019–20, by age group. In general, the rates rose over time across all age groups until 2018–19 before declining from 2018–19 to 2019–20. Hospitalisations also rose with age. Among those aged 45–54, the rate rose from 5.4 per 1,000 in 2012–13 to 7.2 per 1,000 in 2018–19 before declining to 6.4 per 1,000 in 2019–20. Among those aged 75 and over, the rate rose from 56 per 1,000 in 2012–13 to 77 per 1,000 in 2018–19 before declining to 69 per 1,000 in 2019–20.
Hospitalisations for diseases of the eye, non-Indigenous persons by age, 2012–13 to 2019–20
This line graph shows non-Indigenous hospitalisation rates for diseases of the eye, in 2012–13 to 2019–20, by age group. In general, the rates rose over time across all age groups until 2018–19 before declining from 2018–19 to 2019–20. Hospitalisations also rose with age. Among those aged 45–54, the rate rose from 5.5 per 1,000 in 2012–13 to 6.2 per 1,000 in 2018–19 before declining to 5.5 per 1,000 in 2019–20. Among those aged 75 and over, the rate rose from 100 per 1,000 in 2012–13 to 111 per 1,000 in 2018–19 before declining to 97 per 1,000 in 2019–20.
Hospitalisations for diseases of the eye, by Indigenous status, 2012–13 to 2019–20
This line graph shows hospitalisation rates for diseases of the eye, from 2012–13 to 2019–20, by Indigenous status. The chart shows that, in this period, the age standardised hospitalisation rate for Indigenous Australians for diseases of the eye increased, from 9.3 to 11 per 1,000. Over the same period, the rate for non-Indigenous Australians increased from 13 to around 14 per 1,000 from 2015–15 to 2018–19 before declining to 13 per 1,000 again in 2019–20. The trend lines show there has been an increase in hospitalisation rates for eye diseases for Indigenous and non-Indigenous Australians over this time.

- In the two-year period 2018–20, there were around 10,100 hospitalisations for Indigenous Australians for diseases of the eye—a crude rate of 6.0 per 1,000 population.
- In 2018–20, for Indigenous Australians, the most common principal diagnosis for hospitalisations for diseases of the eye was disorders of the lens (5,910 hospitalisations or 3.5 per 1,000).
- Age-specific hospitalisation rates were higher among Indigenous Australians than non-Indigenous Australians in 2019–20 for those aged 45 to 54 (6.4 and 5.5 per 1,000, respectively) and 55 to 64 (19.7 and 18.1 per 1,000, respectively).
- Between 2012–13 and 2019–20, the age-standardised hospitalisation rate for diseases of the eye for Indigenous Australians increased from 9.3 to 10.5 per 1,000, while the rate for non-Indigenous Australians decreased from 13.0 to 12.5 per 1,000.


