Trichiasis screening coverage
Measure 2.4.2: The estimated number, and proportion of Indigenous adults screened for trichiasis.
Figure 2.4.2: Trichiasis screening coverage
There are 3 separate charts for this measure showing trichiasis screening coverage in Indigenous communities, by various characteristics.
Trichiasis screening coverage in communities that screened, by age, 2021
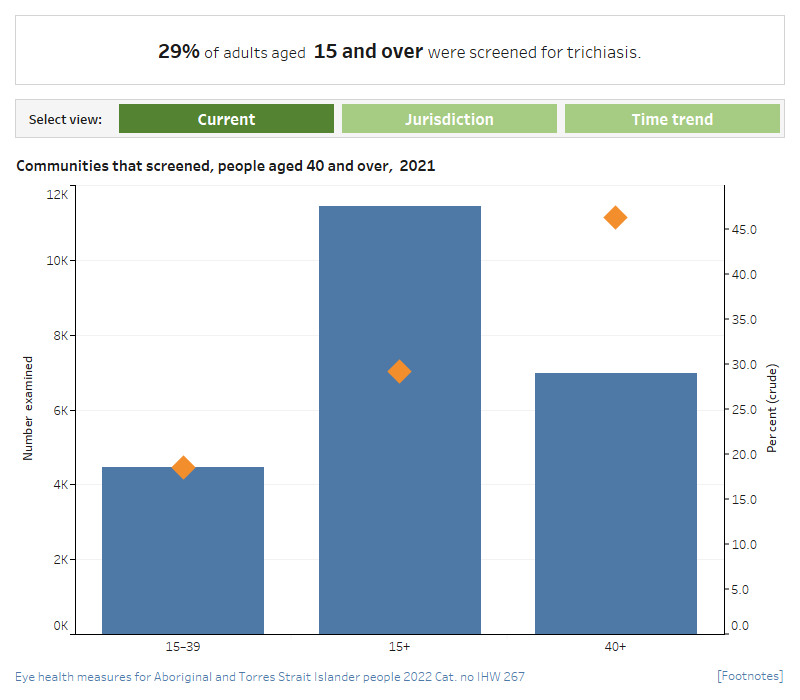
This dual axis combined vertical bar chart and scatter plot presents number and percent screened for trichiasis in Indigenous communities, in 2021, by age group. The chart shows that 4,467 Indigenous Australians aged 15–39 (a rate of 19%) and 6,968 Indigenous adults aged 40 and over (a rate of 46%) were screened for trichiasis in at-risk communities.
Trichiasis screening coverage in communities that screened, Australians aged 40 and over, by jurisdiction, 2021
This dual axis combined vertical bar chart and scatter plot presents the number and proportion screened for trichiasis in Indigenous communities in Queensland, Western Australia, South Australia and the Northern Territory in 2021, for adults aged 40 and over. The proportion screened was highest in Western Australia, (2,671 adults, a rate of 91%) while the number screened was highest in the Northern Territory (3,748 a rate of 39%) The number and rate screened was lowest in Queensland (18 adults, a rate of 6.4%).
Trichiasis screening coverage in communities that screened, Australians aged 40 and over, 2011 to 2021
This dual axis combined line graph scatter plot presents the number and proportion screened for trichiasis in Indigenous communities, in 2011 to 2021. The chart shows that the proportion of Indigenous adults aged 40 and over screened for trichiasis rose from 1,179 (9%) in 2011 to 8,270 (24%) in 2017 before dropping to 6,968 (46%) in 2021, in Western Australia, South Australia and the Northern Territory, the jurisdictions that undertook screening.

- In 2021, 4,467 Indigenous Australians aged 15–39 (19%) and 6,968 Indigenous adults aged 40 and over (46%) were screened for trichiasis in at-risk communities.
- In 2021, the proportion of Indigenous adults aged 40 and over screened for trichiasis was highest in Western Australia (2,671 adults, a rate of 91%) and lowest in Queensland (18 adults, a rate of 6.4%).
- In jurisdictions that undertook screening, the proportion of Indigenous adults aged 40 and over screened for trichiasis rose from 1,179 (9%) in 2011 to 6,968 (46%) in 2021. The number of Indigenous adults aged 40 and over screened for trichiasis was highest in 2020 (8,607, 45%), while the proportion was highest in 2021 (6,968, 46%).


