Treatment of refractive error
Measure 3.9: The number of Indigenous Australians who had spectacle or contact lens correction for refractive error, as a proportion of those who had refractive error (whether or not they had spectacle or contact lens correction).
Treatment of refractive error through the provision of spectacles is a low cost, effective intervention.
Figure 3.9: Treatment of refractive error
There are 4 separate charts showing the estimated percentage of patients treated and confidence intervals, by Indigenous status and other various characteristics. The data is presented as a combined scatter plot for the point estimate and Gant chart representing the confidence interval.
Treatment of refractive error by Indigenous status and age, 2016
This combined scatter plot and Gant chart compares the treatment of refractive error, by age group and by Indigenous status. For Indigenous Australians, the proportion does not change significantly between age groups (due to large confidence intervals), and is between 76% and 86%. For non-Indigenous Australians, no information is available for those aged 40─49, but for those aged 50 and above, the proportion treated is between 91% and 95%.
Treatment of refractive error by Indigenous status and sex, 2016
This combined scatter plot and Gant chart compares the treatment of refractive error, by sex and by Indigenous status. For Indigenous Australians, the proportion does not change significantly between sexes (both 82%), but among non-Indigenous Australians the proportion is slightly higher for females (94% compared with 93%).
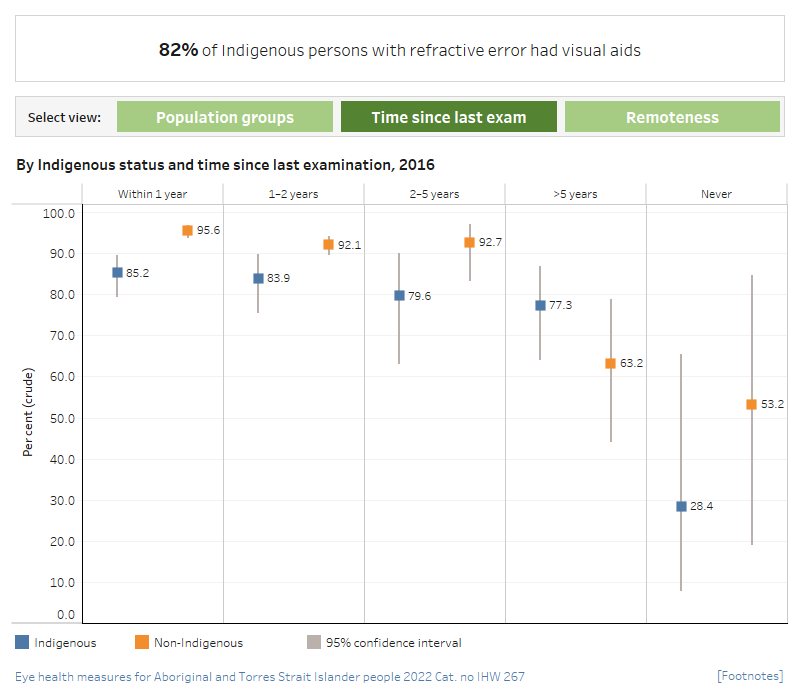
Treatment of refractive error by Indigenous status and time since last exam, 2016
This combined scatter plot and Gant chart compares the treatment of refractive error, by time since last eye exam and Indigenous status. For Indigenous Australians, 85% of those who had had an eye examination in the past year were treated for refractive error. For non-Indigenous Australians, 96% of those who had had an eye examination in the past year were treated for refractive error.
Treatment of refractive error by Indigenous status and region, 2016
This combined scatter plot and Gant chart compares the treatment of refractive error, by remoteness and Indigenous status. For Indigenous Australians, the proportion is highest in Inner regional and Remote areas (both 88%),and lowest in Outer regional areas (70%). Among non-Indigenous Australians the proportion is highest in Remote areas (97%) and lowest in Outer regional and Very remote areas (both 92%).

- In 2016, treatment rates for refractive error were higher for non-Indigenous than Indigenous Australians, at 94% and 82%, respectively.
- In 2016, treatment rates for refractive error for Indigenous Australians in Outer regional (70%) and Very remote (75%) areas were significantly lower than in Major cities (87%), the reference region.
- The treatment rate for non-Indigenous Australians was significantly higher than for Indigenous Australians in Inner regional, Outer regional and Very remote areas.


