Number and rate of ophthalmologists
Measure 4.2: The number of employed ophthalmologists, full-time equivalent (FTE) per 100,000 Australian population.
The size and location of the eye health workforce provides a broad indication of access to eye health services. FTE is a measure calculated by dividing an estimate of the total hours worked by employees in an occupation in a week by an estimate of the standard hours worked for ophthalmologists (40 hours per week). The number of FTE is then compared with the size of relevant population to get the FTE per 100,000 population.
Figure 4.2: Number and rate of ophthalmologists
There are 4 separate charts for this measure showing the number and rate of full-time equivalent (FTE) ophthalmologist per 100,000 population, by various characteristics.
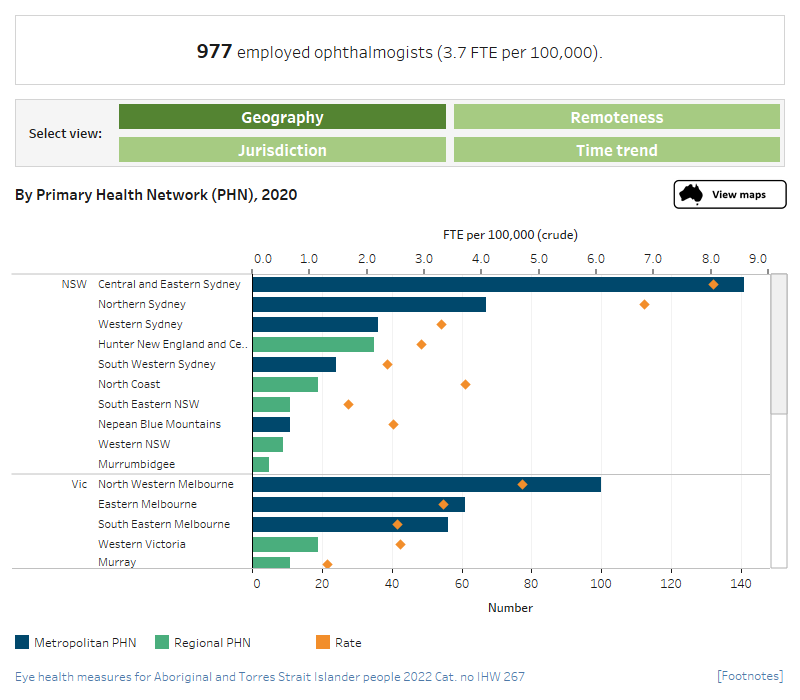
Number and FTE per 100,000 persons, ophthalmologists, primary health network, 2020 (bar chart)
This dual axis combined horizontal bar chart and scatter plot presents the number and FTE rate of ophthalmologists in 2020, by PHN. PHNs have been grouped by state and are ranked from highest to lowest FTE rate within each state grouping. Rates for PHNs with fewer than 10 ophthalmologists have not been published. In NSW the PHN with the highest rate of employed ophthalmologists was Central and Eastern Sydney (8.0 FTE per 100,000). South Eastern NSW has the lowest publishable rate (1.7 FTE per 100,000). In Victoria the PHN with the highest rate of employed ophthalmologists was North Western Melbourne (4.7 FTE per 100,000). Murray has the lowest publishable rate at 1.3 FTE per 100,000.
Number and FTE per 100,000 persons, ophthalmologists by region, 2020
This dual axis combined vertical bar chart and scatter plot presents the number and FTE rate of ophthalmologists in 2020, by remoteness. The chart shows that Major cities had the highest number (821) and rate (4.3 FTE per 100,000) of employed ophthalmologists. This was followed by Inner regional areas (125, or 2.8 FTE per 100,000) and Outer regional areas (28, or 1.6 FTE per 100,000). The numbers and rates of ophthalmologists were lowest in Remote and Very remote areas.
Number and FTE per 100,000 persons, ophthalmologists, by jurisdiction, 2020
This dual axis combined vertical bar chart and scatter plot presents the number and FTE rate of ophthalmologists in 2020, by jurisdiction. The chart shows that the Northern Territory had the lowest number (6, rate not published) of employed ophthalmologists. New South Wales had the highest number (364) and rate (4.4 FTE per 100,000) of employed ophthalmologists.
Number and FTE per 100,000 persons, ophthalmologists, 2012 to 2020
This dual axis combined vertical bar chart and scatter plot presents the number and FTE rate of ophthalmologists, from 2012 to 2020. The chart shows that, between 2012 and 2020, the number and rate of ophthalmologists has increased. In 2012 there were 836 employed ophthalmologists (3.9 FTE per 100,000) and, by 2020, this had increased to 977 (3.7 FTE per 100,000).

- In 2020, there were around 977 ophthalmologists employed in Australia (3.7 FTE per 100,000).
- Between 2012 and 2020, the number of ophthalmologists increased slightly, while the rate remained fairly constant.
- In 2020, Major cities had the highest number (821) and rate (4.3 FTE per 100,000) of employed ophthalmologists, followed by Inner regional areas (125, 2.8 FTE per 100,000) and Outer regional areas (28, or 1.6 FTE per 100,000).


