Self-reported eye or sight problems
Measure 1.1.2 The proportion of Indigenous Australians who reported eye or vision problems
Most of the vision loss experienced by Indigenous Australians is potentially preventable. Measures of the prevalence of vision impairment and blindness are important for monitoring changes in eye health over time and identifying the need for services.
Figure 1.1.2: Self-reported eye or sight problems
Figures for measure 1.1.2 presents 5 separate charts showing self-reported eye and sight problems for Indigenous and non-Indigenous Australians by various characteristics.
Self-reported eye/sight problems among Indigenous Australians by sex, 2018–19
This vertical bar chart compares the proportion of Indigenous Australians who reported an eye or sight problem in 2018–19, by sex. The chart shows that a higher proportion of Indigenous females reported an eye or sight problem (43%), than males (32%).
Self-reported eye/sight problems by Indigenous status, 2001 to 2018–19
This line graph shows time trend data for the period 2001 to 2018–19 for Indigenous and non-Indigenous Australians reporting eye and sight problems. The chart shows that, since 2001, the age-standardised proportion of Indigenous Australians who reported an eye or sight problem increased from 47% to 49% in 2018–19, whereas for non-Indigenous Australians it remained stable around 52%.
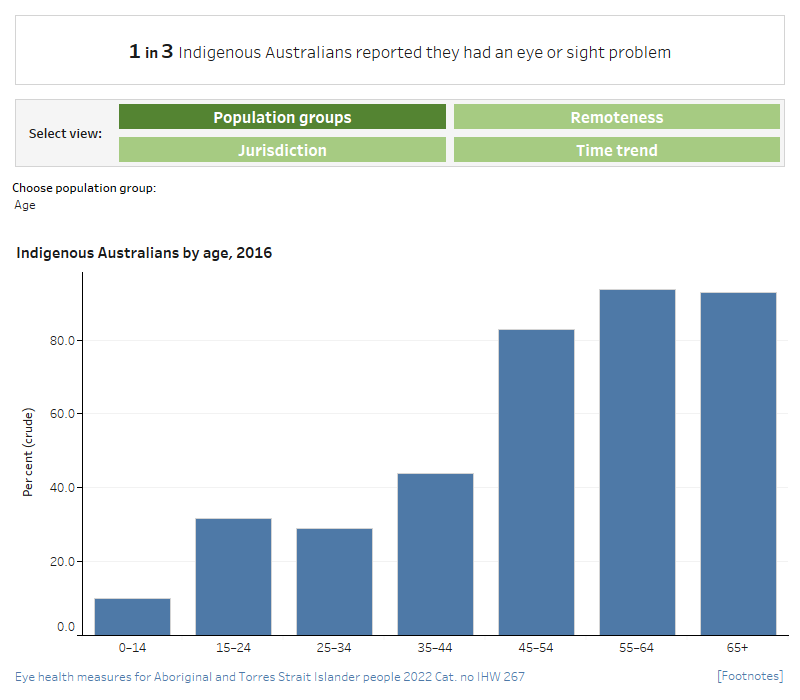
Self-reported eye/sight problems among Indigenous Australians by age, 2018–19
This vertical bar chart compares the proportion of Indigenous Australians who reported an eye or sight problem in 2018–19, by age. The chart shows that the prevalence of self‑reported eye or sight problems was highest for Indigenous Australians aged 55 and over (around 94%), compared with 10% for those aged 0–14.
Self-reported eye/sight problems among Indigenous Australians by region, 2018–19
This vertical bar chart compares the proportion of Indigenous Australians who reported an eye or sight problem in 2018–19, by remoteness of geographic location. The chart shows that Indigenous Australians in Major cities (42%) and Inner regional areas (39%) had a higher prevalence of self-reported eye or sight problems, compared with those in Remote areas (34%) and Very remote areas (27%).
Self-reported eye/sight problems among Indigenous Australians by jurisdiction, 2018–19
This vertical bar chart compares the proportion of Indigenous Australians who reported an eye or sight problem in 2018–19, by state and territory. The chart shows that the percentage self-reporting eye or sight problems was highest in South Australia (49%) and lowest in the Northern Territory (29%).

- In 2018-19, nearly 4 in 10 Aboriginal and Torres Strait Islander Australians (38%, or 307,300 people) reported long-term eye or sight problems.
- In 2018–19, the prevalence of self-reported eye or sight problems was higher for Indigenous females than Indigenous males.
- In 2018–19, the proportion of Indigenous Australians who self-reported eye or sight problems decreased as remoteness increased, from 42% in Major cities to 27% in Very remote areas.
- Since 2001, the age-standardised proportion of Indigenous Australians who had an eye or sight problem increased from 47% to 49% in 2018–19, whereas for non-Indigenous Australians it remained stable at around 52% across this period.


